


 DOWNLOAD


Archives: CreditSights Issuer List
Access this content:
If you are an existing investor, log in first to your Metrobank Wealth Manager account.
If you wish to start your wealth journey with us, click the “How To Sign Up” button.
Fundamental View
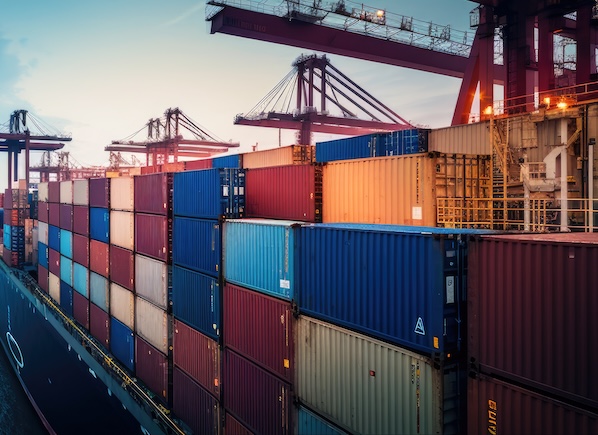
AS OF 04 Mar 2026Stryker benefits from a leading position in orthopedics as well as strong franchises in medical surgery and neurotechnology. The company’s sales and EBITDA growth trajectory bests most of its medical device peers.
Stryker has exhibited discipline with capital allocation. Following larger bolt-on deals in 2022 (Vocera, $3.1 bn) and 2020 (Wright Medical, $5.4 bn) management prioritized debt reduction.
We expect SYK to manage leverage in the low- to mid-2x range as it addresses its M&A needs/wants in the aftermath of the Inari purchase.
Business Description
AS OF 04 Mar 2026- Stryker (SYK) is a global manufacturer of implants used in joint replacement & trauma surgeries; surgical equipment & surgical navigation systems; endoscopic & communications systems; patient handling & emergency medical equipment; neurosurgical, neurovascular & spinal devices among other products. Stryker generated $25.1 bn of revenues in 2025 (versus $22.6 bn in 2024).
- SYK maintains two operating segments: MedSurg & Neurotechnology (62% of 2025 consolidated revenues) and Orthopaedics & Spine (38%).
- SYK's recent sizable acquisitions include: Inari Medical ($4.9 bn) in 2025, which increased its exposure to peripheral vascular diseases; Vocera ($3.1 bn enterprise value) in 2022, which increased its digital care coordination and communication categories; Wright Medical ($5.6 bn including debt) in 2020, which increased its exposure to the trauma & extremities end market; and K2M Group ($1.4 bn) in 2018, which boosted the spine portfolio.
Risk & Catalysts
AS OF 04 Mar 2026Stryker is exposed to medical procedure volumes. While volumes have been positive, owing in part to the resumption of procedures deferred during COVID, volatility could result from economic uncertainty in the year ahead.
Stryker’s M&A interest has leaned bolt-on in nature over the past several years, including the acquisitions of Inari in 2025 ($4.9 bn), Vocera in 2022 ($3.1 bn) and Wright Medical in late 2020 ($5.4 bn).
In April 2025, SYK sold its US Spinal Implants business to Viscogliosi Brothers to create a newly formed company (named VB Spine, LLC).
SYK recently held its investor day, which covered expectations for 2026-28. Management expects organic sales growth to be at the ‘high end’ of MedTech and guides to operating margin expansion of ~150 bp through 2028. M&A remains Stryker’s top capital allocation priority.
Key Metric
AS OF 04 Mar 2026| $ mn | Y21 | Y22 | Y23 | Y24 | LTM 4Q25 |
|---|---|---|---|---|---|
| Revenue | 17,108 | 18,449 | 20,498 | 22,595 | 25,116 |
| Gross Profit | 10,968 | 11,578 | 13,058 | 14,440 | 16,065 |
| R&D | (1,235) | (1,454) | (1,388) | (1,466) | (1,623) |
| SG&A | (6,427) | (6,455) | (7,121) | (7,685) | (8,651) |
| Adj. EBITDA | 4,753 | 4,755 | 5,356 | 6,142 | 7,064 |
| Total Debt | 12,479 | 13,048 | 12,995 | 13,597 | 15,859 |
| Gross Leverage | 2.6x | 2.7x | 2.4x | 2.2x | 2.2x |
| Interest Coverage | 14.1x | 14.1x | 15.0x | 15.5x | 12.1x |
CreditSight View Comment
AS OF 13 Mar 2026We maintain our Outperform recommendation on Stryker. SYK exhibits organic growth on strong procedural volumes and relatively healthy capital equipment spending. At current spreads, we like SYK versus more conservative peers, ABT and MDT, both of which carry higher leverage with less impressive organic growth. SYK offers attractive spread pickup versus both comps.
Recommendation Reviewed: March 13, 2026
Recommendation Changed: May 03, 2022
Featured Issuers
Perusahaan Listrik Negara
Hyundai Motor
Republic of the Philippines


How may we help you?
Search topics about wealth insights and investments.BDO Unibank
- Sector: Financial Services
- Sub Sector: Banks
- Country: Philippines
- Bond: BDOPM 4.375 30
- Indicative Yield-to-Maturity (YTM): 4.26%
Access this content:
If you are an existing investor, log in first to your Metrobank Wealth Manager account.
If you wish to start your wealth journey with us, click the “How To Sign Up” button.
Fundamental View
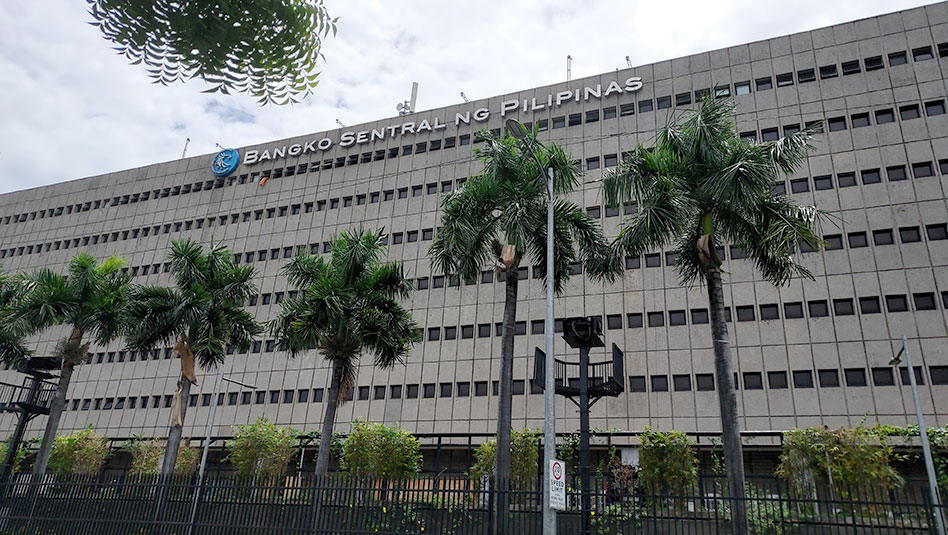
AS OF 03 Mar 2026BDO Unibank (BDO) is the largest bank in the Philippines in terms of assets & market share.
Given its size and systemic importance, BDO is considered too big to fail and is strongly likely to be supported by its controlling shareholder SM Investments, as well as the Philippine government in times of stress.
BDO is widely viewed as the soundest bank in the country given its strong fundamentals, well-diversified businesses, and good management.
Business Description
AS OF 03 Mar 2026- BDO Unibank was established as Acme Savings Bank in 1968, and was then acquired by SM Investments in 1976. It became a commercial bank in 1994 and a universal bank in 1996.
- BDO was listed in May 2002. SM Investments remains the bank's largest shareholder with a 41% stake.
- BDO has expanded through a series of M&As. Among its key transactions, it merged with Dao Heng Bank Philippines in 2001, Banco Santander Philippines in 2003, UOB Philippines in 2005, Equitable PCI Bank in 2007, GE Money Bank in 2009, Citibank Savings, DB Trust and Real Bank in 2014, One Network Bank in 2015 (the largest rural bank in the Philippines), and RB Pandi's banking business in 2019. It also acquired the insurance business of Generali in the Philippines in 2016.
- BDO has the largest distribution network in the country and is ranked the largest bank in terms of consolidated resources, total assets, loans, deposits and trust funds under management.
- Its loan book was split 49% large corporates, 26% middle market, and 25% consumer at 4Q25. 39% of the consumer book comprised mortgages, 31% credit cards, 13% auto loans and the remaining personal loans (13%) and others (5%).
Risk & Catalysts
AS OF 03 Mar 2026Direct impact from US tariffs is limited given that the Philippines is not a major goods exporter, but there is likely to be some second order effects from a slowdown in regional and global growth.
The recent public infrastructure graft scandal has dampened public infra spending, consumer and business sentiment, and private investment, which will weigh on GDP and corporate loan growth at least through 1H26. A prolonged hit to sentiment would exacerbate these effects and strain asset quality. BSP rate cuts to support growth will pressure the NIM, but this is being mitigated by a loan mix shift towards retail.
We see few asset quality risks for BDO given a comfortable NPL cover and an acceptable CET1 ratio, as well as BDO’s large corporates book (~50% of total loans) and good underwriting track record.
Any rating downgrade of the Philippine sovereign would negatively impact BDO.
Key Metric
AS OF 03 Mar 2026| PHP mn | FY21 | FY22 | FY23 | FY24 | FY25 |
|---|---|---|---|---|---|
| NIM | 4.05% | 4.14% | 4.37% | 4.35% | 4.31% |
| Reported ROA (Cumulative) | 1.2% | 1.5% | 1.7% | 1.8% | 1.7% |
| Reported ROE (Cumulative) | 10.4% | 13.0% | 15.2% | 15.1% | 14.4% |
| Equity/Assets | 11.7% | 11.3% | 11.5% | 11.8% | 11.8% |
| CET1 Ratio | 13.6% | 13.4% | 13.8% | 14.1% | 13.8% |
| NPL ratio | 2.8% | 2.0% | 1.9% | 1.8% | 1.7% |
| Provisions/Loans | 0.72% | 0.64% | 0.59% | 0.46% | 0.43% |
| PPP ROA | 2.1% | 2.3% | 2.7% | 2.5% | 2.4% |
| Liquidity Coverage Ratio | 145% | 141% | 123% | 132% | 121% |
| Net Stable Funding Ratio | 124% | 124% | 124% | 122% | 118% |
CreditSights View
AS OF 06 Mar 2026BDO is the largest bank in the Philippines. Management is well-regarded, the business is well-diversified and it is the market leader in many business lines. The NIM has peaked with the turn in policy rates, but non-interest income is close to a third of operating income given good fee generation and overall core profitability is strong. We remain comfortable with BDO given the large corporate book and comfortable NPL cover, as well as underwriting track record, which provide comfort around the recently robust growth in retail loans. Capital is also acceptable with the CET1 ratio at 13.8%. However, we have BDO on Underperform from an RV standpoint.
Recommendation Reviewed: March 06, 2026
Recommendation Changed: January 07, 2026
Featured Issuers
Perusahaan Listrik Negara
Hyundai Motor
Republic of the Philippines
How may we help you?
Search topics about wealth insights and investments.Access this content:
If you are an existing investor, log in first to your Metrobank Wealth Manager account.
If you wish to start your wealth journey with us, click the “How To Sign Up” button.
Fundamental View
AS OF 03 Mar 2026AZN enjoys one of the strongest growth profiles in our coverage, reflecting a portfolio of innovative medicines, particularly in Oncology. The addition of Alexion supports AZN’s growth prospects, bringing strong assets in immune-mediated rare diseases.
AZN also enjoys relatively strong diversification, with core sales coming from multiple therapeutic areas and with depth across its Oncology and Biopharma platforms.
AZN’s capital allocation priorities include investment in the business, the pursuit of value-enhancing bolt-on M&A, and support for the dividend.
Business Description
AS OF 03 Mar 2026- AstraZeneca is a UK-based pharmaceutical company that researches, develops, and manufactures drugs with a focus in (i) Oncology, (ii) Cardiovascular, Renal and Metabolism (CVRM), (iii) Respiratory and Immunology, (iv) Rare Disease, and (v) Vaccines and Immune.
- AstraZeneca operates in five primary segments: Oncology, CVRM (cardiovascular, renal, and metabolism), Respiratory and Immunology, Rare Diseases, and V&I (Vaccines and Immune). AstraZeneca reported FY25 revenues of $58.7 bn, with ~44% from Oncology, ~23% from CVRM, ~22% from Respiratory and Immunology, and ~16% from Rare Diseases.
- In recent years, AstraZeneca has acquired Alexion for $39 bn, CinCor for $1.8 bn, Fusion for $2 bn, among other smaller transaction.
Risk & Catalysts
AS OF 03 Mar 2026Given that AZN’s leverage has been largely restored to pre-Alexion levels, we expect limited deliberate improvement from here. However, we expect future shareholder rewards and business development to be managed somewhat conservatively.
AstraZeneca has shown discipline with respect to leverage and capital allocation in recent years. While AstraZeneca pays a relatively aggressive dividend (~32% of LTM FCF), the company has historically been very conservative with share repurchases and has even used share issuance to fund certain acquisitions.
AZN recently lost a patent-infringement lawsuit against Samsung Biologics regarding a biosimilar version of Soliris.
Key Metric
AS OF 03 Mar 2026| $ mn | Y20 | Y21 | Y22 | Y23 | Y24 | LTM 4Q25 |
|---|---|---|---|---|---|---|
| Revenue | 26,617 | 37,417 | 44,351 | 45,811 | 54,073 | 58,739 |
| Gross Profit | 21,318 | 24,980 | 31,960 | 37,543 | 43,866 | 48,106 |
| R&D | (5,991) | (9,736) | (9,762) | (10,935) | (13,583) | (14,232) |
| SG&A | (11,294) | (15,234) | (18,419) | (19,216) | (19,977) | (19,933) |
| Adj. EBITDA | 8,680 | 11,506 | 14,507 | 15,641 | 18,208 | 19,914 |
| Total Debt | 19,699 | 29,794 | 28,279 | 27,494 | 28,843 | 27,819 |
| Gross Leverage | 2.3x | 2.6x | 1.9x | 1.8x | 1.6x | 1.4x |
| Interest Coverage | 11.8x | 16.0x | 17.1x | 14.5x | 13.9x | 13.4x |
CreditSight View Comment
AS OF 03 Apr 2026We reiterate our Outperform recommendation on AstraZeneca. AZN benefits from a deep portfolio of innovative medicines and one of the strongest growth trajectories in the space (trailing only Eli Lilly). We see AZN as attractive versus NVS (U/P), a name with a less compelling growth narrative and modestly higher net leverage.
Recommendation Reviewed: April 03, 2026
Recommendation Changed: April 01, 2021
Featured Issuers
Perusahaan Listrik Negara
Hyundai Motor
Republic of the Philippines
How may we help you?
Search topics about wealth insights and investments.Access this content:
If you are an existing investor, log in first to your Metrobank Wealth Manager account.
If you wish to start your wealth journey with us, click the “How To Sign Up” button.
Fundamental View
AS OF 25 Feb 2026UOB has solid stand-alone credit profile and benefits from the high likelihood of support from the government of Singapore, where it is one of the three major local banks.
The bank is more focused on Singapore and Southeast Asia than on Greater China; its traditional strengths are the SME and retail sectors, although its large corporate book is now over 60% of loans.
UOB has been conservatively managed with a sound risk profile, a strong focus on liquidity and a long track record of relatively good performance. However, its FY25 results showed some softness with substantial provisions set aside for HK and US CRE.
Business Description
AS OF 25 Feb 2026- UOB was established in 1935 as a Chinese family-owned bank catering to the Hokkien (Fujian) community, Singapore's largest Chinese ethnic sub-group. The Wee family owns about 18% of the shares. A further 5.2% is held by the Lien family which previously controlled Overseas Union Bank, which UOB merged within 2001. The Wee family has significant real estate and hospitality interests in Singapore and regionally.
- UOB's main markets are Singapore and Malaysia where its presence dates back to before Singapore's independence. It expanded through acquisitions in Thailand (Bank Radanasin and Bank of Asia) and Indonesia (Bank Buana), and more recently bought over Citi's consumer franchise in Malaysia, Thailand, Indonesia and Vietnam.
- Franchise strengths are in SME and consumer lending. Building & construction accounts for 26% of loans, followed by housing at 24%, financial institutions at 11% and general commerce at 11% at 4Q25.
- Loans by geography comprise Singapore at 50% of loans, Greater China at 13%, Malaysia at 10%, Thailand at 8%, and Indonesia at 3% at 4Q25.
Risk & Catalysts
AS OF 25 Feb 2026UOB has a greater focus on Southeast Asia than its Singapore bank peers, which leaves it open to more asset quality risk in a downturn / high interest rate environment. It has 8% of its loan book in Thailand and 3% in Indonesia, where we are cautious about macroeconomic conditions.
The bank has benefited more from the final Basel III rules implementation than its peers – its CET 1 ratio was previously the lowest among the three but now aligns with peers.
It posted a large profit decline in FY25 which was a negative surprise. Although the improved coverage ratios following the preemptive provision recognition are welcome, its NPL coverage ratio remains 30-50 ppt behind peers. Topline performance also lagged peers.
Key Metric
AS OF 25 Feb 2026| SGD mn | FY21 | FY22 | FY23 | FY24 | FY25 |
|---|---|---|---|---|---|
| PPP ROA | 1.23% | 1.31% | 1.52% | 1.50% | 1.38% |
| ROA | 0.92% | 0.99% | 1.19% | 1.16% | 0.86% |
| ROE | 10.2% | 11.9% | 14.2% | 13.3% | 9.6% |
| Equity to Assets | 9.3% | 8.6% | 8.8% | 9.2% | 9.0% |
| CET1 Ratio (fully-loaded) | 13.5% | 13.3% | 13.4% | 15.4% | 14.9% |
| NPL Ratio | 1.62% | 1.58% | 1.52% | 1.53% | 1.53% |
| Provisions / Loans | 0.20% | 0.20% | 0.25% | 0.27% | 0.55% |
| Liquidity Coverage Ratio | 133% | 147% | 158% | 148% | 143% |
| Net Stable Funding Ratio | 116% | 116% | 120% | 116% | 116% |
CreditSight View Comment
AS OF 24 Feb 2026UOB is conservatively run with a large family ownership and a sound balance sheet. The bank is more focused on SG and Southeast Asia than on Greater China. Outside SG, its main operations in ASEAN are in Thailand, Malaysia and Indonesia which collectively make up ~20% of its loan book. It acquired Citi’s consumer operations in Thailand, Malaysia, Indonesia and Vietnam, which has been good for the franchise. The bank has benefitted more from the final Basel III rules implementation than its peers but it has lost this advantage again since 3Q25. The substantial preemptive provisions taken in 3Q25 to strengthen coverage ratios heavily hit the bank’s 2H25 results, but UOB’s NPL coverage ratio remained 40-60 ppt behind the two peers. New NPAs have risen due to its CRE exposure in HK and the US.
Recommendation Reviewed: February 24, 2026
Recommendation Changed: July 04, 2017
Featured Issuers
Perusahaan Listrik Negara
Hyundai Motor
Republic of the Philippines
How may we help you?
Search topics about wealth insights and investments.Access this content:
If you are an existing investor, log in first to your Metrobank Wealth Manager account.
If you wish to start your wealth journey with us, click the “How To Sign Up” button.
Fundamental View
AS OF 25 Feb 2026ICICI Bank is one of the leading private banks in India and has a good diversified business model, with well regarded life and general insurance subsidiaries.
Under its previous CEO, the bank suffered setbacks from sizeable bad debt problems in FY17/18, but the situation has since stabilised following a leadership change and the bank has done well ever since.
Business Description
AS OF 25 Feb 2026- The original Industrial Credit and Investment Corporation of India (ICICI) was established in 1955 by the World Bank, the Government of India and representatives of Indian industry as a financial institution to provide Indian businesses with medium and long-term project financing.
- In 1994, ICICI established a commercial banking subsidiary, ICICI Bank as India's financial sector opened up, and in 2002 ICICI merged with ICICI Bank, keeping the latter's name.
- Retail now accounts for 51% of its loan book, corporates are at 20%, while rural and business banking & SMEs are at 6% and 21% respectively, and overseas (which is being de-emphasised) consists of just 2% at F3Q26.
- The bank has well regarded life insurance (ICICI Prudential) and general insurance (ICICI Lombard) businesses.
Risk & Catalysts
AS OF 25 Feb 2026RBI repo rate cuts will initially impact the NIM before the lagged effect of deposit repricing catches up over FY26-27.
System loan growth has picked up and should stay robust in coming quarters, supported by GST rate cuts lifting consumption, and improving corporate borrowing momentum amid India’s trade deals with the US and EU and robust public-sector infrastructure capex.
We are cautious about pockets of stress in Indian retail, particularly unsecured retail and microfinance. However, ICICI’s prudence towards the segment than peers, and the banks not playing in the small ticket segment in general, are keeping asset quality well controlled.
Leadership and governance issues under the previous CEO Ms. Chanda Kochhar have been dealt with well, since her replacement in Oct-18.
Key Metric
AS OF 25 Feb 2026| INR bn | FY22 | FY23 | FY24 | FY25 | 9M26 |
|---|---|---|---|---|---|
| NIM | 3.96% | 4.48% | 4.53% | 4.32% | 4.31% |
| ROAA | 1.77% | 2.13% | 2.37% | 2.37% | 2.26% |
| ROAE | 14.7% | 17.2% | 18.7% | 17.9% | 15.9% |
| Equity/Assets | 12.1% | 12.6% | 12.7% | 13.7% | 14.6% |
| CET1 Ratio | 17.3% | 16.9% | 15.4% | 15.8% | 14.6% |
| Gross NPA Ratio | 3.60% | 2.81% | 2.16% | 1.67% | 1.53% |
| Provisions/Loans | 0.97% | 0.65% | 0.30% | 0.34% | 0.47% |
| PPP ROA | 2.97% | 3.28% | 3.36% | 3.37% | 3.30% |
CreditSight View Comment
AS OF 25 Feb 2026ICICI Bank is a preferred name among the Indian FIs we cover. We like the bank’s robust capital and loan loss buffers, strong asset quality, as well as peer leading margins, profitability and liquidity position. Under its previous CEO, the bank suffered setbacks from sizable bad debt problems in FY17/18 but the situation has since stabilised following a leadership change. The bank has emerged stronger from a capital, asset quality and earnings perspective, as it de-risked its book, and took pro-active actions to protect its capital by raising equity and selling small stakes in its well-regarded insurance subsidiaries to raise funds and set aside more general provisions. ICICI last issued a $ bond in 2017; we have ICICI on M/P given likely low trading liquidity.
Recommendation Reviewed: February 25, 2026
Recommendation Changed: December 07, 2020
Featured Issuers
Perusahaan Listrik Negara
Hyundai Motor
Republic of the Philippines
How may we help you?
Search topics about wealth insights and investments.Access this content:
If you are an existing investor, log in first to your Metrobank Wealth Manager account.
If you wish to start your wealth journey with us, click the “How To Sign Up” button.
Fundamental View
AS OF 24 Feb 2026Standard Chartered has been making good progress in the past few years, improving its asset quality and profitability and dealing with legacy litigation issues. Capital, funding and liquidity look solid.
However, tensions between China and the West, including reciprocal trade tariffs between the US and China, and global economic headwinds continue to cloud the near term outlook.
Its unusual business mix – headquartered and regulated in the UK but operating primarily in Asia, Africa and the Middle East – means it is well diversified but sensitive to geopolitical developments and emerging market volatility.
Business Description
AS OF 24 Feb 2026- Standard Chartered PLC is the holding company and listed entity of the group, in which Standard Chartered Bank is the main operating company.
- Although Standard Chartered is headquartered in London and therefore subject to UK banking regulation, its operations are mainly in Asia (Hong Kong is its biggest single market, Africa and the Middle East. It is present in over 60 markets.
- It has the usual variety of businesses across these regions, including corporate and institutional banking, retail banking, commercial banking and private banking. It specialises in trade finance and cross-border cash management.
- It is classified as a G-SIB, with a regulatory capital buffer of 1%.
Risk & Catalysts
AS OF 24 Feb 2026Political tensions in Hong Kong, a slowing economy in China and a weak commercial real estate sector, and a US/China trade war have threatened the growth and stability of some of Standard Chartered’s key markets.
A number of Standard Chartered’s markets have underperformed in the past but are now turnaround stories, including India, Korea, Indonesia and the UAE.
The group has had to improve its AML and sanctions controls. In April 2019, it paid a $947 mn fine to US authorities over breaches of US sanctions and a £102 mn fine to the UK FCA for AML weaknesses.
Key Metric
AS OF 24 Feb 2026| $ mn | 4Q25 | Y25 | Y24 | Y23 | Y22 |
|---|---|---|---|---|---|
| Return on Equity | 3.5% | 9.7% | 8.0% | 7.0% | 5.7% |
| Total Revenues Margin | 2.4% | 2.4% | 2.3% | 2.2% | 2.0% |
| Cost/Income | 79.4% | 63.5% | 64.0% | 64.1% | 66.9% |
| CET1 Ratio (Transitional) | 14.1% | 14.1% | 14.2% | 14.1% | 14.0% |
| CET1 Ratio (Fully-Loaded) | 14.1% | 14.1% | 14.2% | 14.1% | 13.9% |
| Leverage Ratio (Fully-Loaded) | 4.7% | 4.7% | 4.8% | 4.7% | 4.8% |
| Loan Impairment Charge | 0.2% | 0.2% | 0.2% | 0.2% | 0.3% |
| Impaired Loans (Gross)/Total Loans | 2.1% | 2.1% | 2.2% | 2.5% | 2.5% |
CreditSight View Comment
AS OF 27 Feb 2026We revised our recommendation on Standard Chartered HoldCo senior from Underperform to Market perform on 26 April 2023, but we changed our recommendations on Tier 2 and AT1 from Fair to Rich on 10 January 2024. The changes reflect StanChart’s recent resilient performance, while taking into account the potential impact from US tariffs policies and exposure to China. Capital and liquidity ratios are robust, and profitability has improved significantly, but the bank continues to face geopolitical tensions inherent in its extensive operations in Hong Kong, China and the rest of Asia.
Recommendation Reviewed: February 27, 2026
Recommendation Changed: April 26, 2023
Featured Issuers
Perusahaan Listrik Negara
Hyundai Motor
Republic of the Philippines
How may we help you?
Search topics about wealth insights and investments.Bangkok Bank
- Sector: Financial Services
- Sub Sector: Banks
- Region: Thailand
- Bond: BBLTB 4.507 30
- Indicative Yield-to-Maturity (YTM): 4.39%
Access this content:
If you are an existing investor, log in first to your Metrobank Wealth Manager account.
If you wish to start your wealth journey with us, click the “How To Sign Up” button.
Fundamental View
AS OF 24 Feb 2026Bangkok Bank is a family run conservative financial institution, with high capital and liquidity levels.
It acquired Indonesia’s Permata Bank in 2020 which resulted in a meaningful decline in its CET1 ratio to 14%. It has been built back to 17%. Management aims to keep the CET1 ratio above ~16% in preparation for Basel III final reforms.
Profitability (ROA and ROE) has historically been below the industry average, due in part to higher exposure to the lower-yielding corporates segment that has resulted in a lower NIM. However, the returns gap has narrowed as this has supported its relatively better asset quality than most peers in a prolonged sluggish macroeconomic environment.
Business Description
AS OF 24 Feb 2026- Bangkok Bank was set up in 1944 and was listed on the Stock Exchange of Thailand in 1975. It is a family-run bank and the current President of the bank, Chartsiri Sophonpanich, is the grandson of the founder of the bank.
- It is the largest bank by assets in Thailand. It was briefly surpassed by Kasikornbank in 2018, but the Bank Permata acquisition has taken BBL back to No.1.
- The bank is corporate-loan focused, and the loan book was split 49% corporate, 16% SME, 12% retail, and 23% international as at December 2025. It is by far the most international amongst the Thai banks, with branches in 14 economies.
- BBL's overseas presence has been enhanced by the acquisition of Bank Permata, the 12th largest bank in Indonesia. Bank Permata's asset size is ~10% of that of BBL.
Risk & Catalysts
AS OF 24 Feb 2026Thai economic growth is expected to slowdown this year from US tariffs. Ripple effects are in the form of lower bank NIMs as more BOT rate cuts come through to support growth, and credit costs remaining relatively elevated. Moody’s and Fitch have downgraded their rating outlook on the Thailand sovereign (and consequently the Thai banks including BBL at Moody’s, which it currently rates in line with the sovereign) to negative in April and September 2025 respectively on increased risks to Thailand’s economic and fiscal strength.
We see still middling loan growth across the Thai banks due to a focus on quality amid the current backdrop. Trading/investment income is also set to moderate from a high base given a smaller rates tailwind this year. However, we take comfort in BBL’s prudent provisioning, high loan loss buffers and safer large corporate book.
The acquisition of Bank Permata of Indonesia in May 2020 provides BBL with exposure to the high growth opportunities of the Indonesian market, but this also presents higher risks.
Key Metric
AS OF 24 Feb 2026| THB mn | FY21 | FY22 | FY23 | FY24 | FY25 |
|---|---|---|---|---|---|
| PPP ROA | 1.65% | 1.60% | 1.92% | 2.02% | 2.01% |
| ROA | 0.65% | 0.67% | 0.93% | 1.00% | 1.00% |
| ROE | 5.6% | 5.9% | 8.1% | 8.3% | 8.2% |
| Equity / Assets | 11.4% | 11.5% | 11.8% | 12.2% | 12.5% |
| CET1 Ratio | 15.2% | 14.9% | 15.4% | 16.2% | 17.2% |
| Calculated NPL ratio | 3.20% | 3.10% | 2.70% | 2.70% | 3.00% |
| Provisions / Loans | 1.38% | 1.24% | 1.26% | 1.30% | 1.36% |
| Gross LDR | 82% | 84% | 84% | 85% | 82% |
| Liquidity Coverage Ratio | 270% | 271% | 277% | 265% | n/m |
CreditSights View
AS OF 22 Jan 2026Bangkok Bank’s strength has been its large corporate book and strong capital. It completed the acquisition of Indonesia’s Bank Permata (~12% of loans) in 2Q20 which reduced its CET1 ratio to 14%, but it has since rebuilt it to ~17-18%. Returns though have been lower due to thinner corporate margins, and we see greater NIM pressure on BBL than most peers from the turn in base rates. Disclosure from BBL is less than peers and credit costs rose again in FY25. However, we take comfort in BBL’s strong loss buffers and large corporate book. We also see a meaningful impact to the Thai economy from US tariffs, with ripple effects in the form of lower bank NIMs and continued high credit costs. We have it on Market perform as its recent longer dated issues trade at fair levels.
Recommendation Reviewed: January 22, 2026
Recommendation Changed: December 03, 2025
Featured Issuers
Perusahaan Listrik Negara
Hyundai Motor
Republic of the Philippines
How may we help you?
Search topics about wealth insights and investments.Access this content:
If you are an existing investor, log in first to your Metrobank Wealth Manager account.
If you wish to start your wealth journey with us, click the “How To Sign Up” button.
Fundamental View
AS OF 24 Feb 2026Bank Mandiri (Mandiri) is the largest state-owned bank in Indonesia with 60% government ownership. We therefore expect a very high likelihood of government support in times of need.
Mandiri’s strength had been its large corporate loan portfolio, which has allowed the bank to book lower credit costs compared to its peers in recent years. Mandiri is well capitalised in line with the other Indonesian banks that have relatively high CET1 ratios in the region, though we expect this to be reduced by higher dividend payouts over time.
Business Description
AS OF 24 Feb 2026- Bank Mandiri was established as a result of the mergers of four state-owned banks, Bank Bumi Daya, Bank Dagang Negara, Bank Ekspor Impor Indonesia, and Bank Pembangunan Indonesia, in the late 1990s. The bank was first listed in Indonesia Stock Exchange in 2003.
- The Indonesian government holds a 60% stake in the bank. Foreign investors have a 32% shareholding while domestic investors have another 8%.
- Corporates accounted for 40% of total loans, consumer for 7%, micro & payroll for 10%, SME for 5%, commercial for 17% and subsidiaries 21% at December 2025.
Risk & Catalysts
AS OF 24 Feb 2026Macro overhang continues as fiscal concerns over aggressive growth/social agendas and questions over central bank independence persist. Despite a stronger 4Q25/FY25 and a positive medium-term growth narrative under Prabowo’s term, skepticism remains amid soft ground-level activity and signs of a shrinking middle class. Moody’s has shifted the sovereign outlook to negative.
Margin pressure persists. IDR weakness due to macro concerns has constrained system liquidity; relief has been short-lived. Opportunistic BI cuts (when FX pressures ease) and subsidised government programs (e.g., village cooperative loans) to support growth will further compress NIMs.
Governance/transparency risks at Danantara remain, and the transfer of SOE banks (including Mandiri) increases the risk of higher dividend payouts to fund government priorities. However, we are comfortable with the CET1 ratio dropping to the 14-16% range of other APAC banks.
Retail is under strain, but asset quality has trended better than peers due to a large-corporate tilt. Increased state-directed lending to less commercially viable projects though could pressure credit metrics over time.
Key Metric
AS OF 24 Feb 2026| IDR bn | FY21 | FY22 | FY23 | FY24 | FY25 |
|---|---|---|---|---|---|
| PPP ROA | 3.5% | 3.9% | 4.1% | 3.8% | 3.3% |
| ROA | 1.7% | 2.2% | 2.6% | 2.4% | 2.1% |
| ROE | 14.2% | 19.0% | 22.4% | 20.5% | 19.5% |
| Equity/Assets | 11.9% | 11.5% | 12.0% | 11.7% | 10.4% |
| CET1 Ratio | 18.4% | 18.6% | 20.8% | 19.6% | 19.3% |
| NPL Ratio | 2.72% | 1.92% | 1.19% | 1.12% | 1.13% |
| Provisions/Average Loans | 1.98% | 1.41% | 0.79% | 0.77% | 0.57% |
| LDR | 81% | 81% | 89% | 98% | 90% |
CreditSight View Comment
AS OF 31 Mar 2026Mandiri is the biggest bank in Indonesia by assets and 60% government owned. It weathered the pandemic well given its focus on large corporates. Funding cost pressure from the tight liquidity environment has eased with recent government stimulus, and loan growth has picked up. Margins though are under pressure from state-subsidized lending programs and rate cuts impacting wholesale lending yields. Soft economic momentum, retail asset quality strains and higher governance risks are also headwinds. Fundamentals however remain sound with a corporates focused book, strong capital and healthy profitability. We expect higher dividend payouts to gradually reduce capital ratios but are comfortable with a 14-16% CET1 ratio. We have Mandiri on U/P due to Indonesia’s macro uncertainty overhang.
Recommendation Reviewed: March 31, 2026
Recommendation Changed: September 02, 2025
Featured Issuers
Perusahaan Listrik Negara
Hyundai Motor
Republic of the Philippines
How may we help you?
Search topics about wealth insights and investments.Access this content:
If you are an existing investor, log in first to your Metrobank Wealth Manager account.
If you wish to start your wealth journey with us, click the “How To Sign Up” button.
Fundamental View
AS OF 24 Feb 2026Bank Negara Indonesia (BNI) is the fourth largest commercial bank in Indonesia.
The bank is majority-owned by the Indonesian government (60%) and receives strong state support in the form of well-established relationships with SOEs, an area that the bank heavily loans to.
BNI’s asset quality has shown a steady improvement after COVID headwinds in Indonesia, through de-risking its loan portfolio by focusing growth on top tier private corporates. It is now going for balanced loan growth across segments.
Business Description
AS OF 24 Feb 2026- Bank Negara Indonesia was founded in 1946, initially as a central bank, before becoming a commercial bank in 1968. It is now the 4th largest commercial bank in Indonesia by assets.
- The bank is majority-owned by the state (60%) and focuses its lending toward SOEs and domestic corporates.
- BNI's loan book is split 58% corporates, 23% small and medium enterprises and 17% retail, with the remaining coming from its subsidiaries at December 2025.
Risk & Catalysts
AS OF 24 Feb 2026Macro overhang continues as fiscal concerns over aggressive growth/social agendas and questions over central bank independence persist. Despite a stronger 4Q25/FY25 and a positive medium-term growth narrative under Prabowo’s term, skepticism remains amid soft ground-level activity and signs of a shrinking middle class. Moody’s has shifted the sovereign outlook to negative.
Margin pressure persists. IDR weakness due to macro concerns has constrained system liquidity; relief has been short-lived. Opportunistic BI cuts (when FX pressures ease) and subsidised government programs (e.g., village cooperative loans) to support growth will further compress NIMs.
Governance/transparency risks at Danantara remain, and the transfer of SOE banks (including BNI) increases the risk of higher dividend payouts to fund government priorities. However, we are comfortable with the CET1 ratio dropping to the 14-16% range of other APAC banks.
Retail is under strain, but asset quality has trended better than peers due to a large-corporate tilt. Increased state-directed lending to less commercially viable projects though could pressure credit metrics over time.
Key Metric
AS OF 24 Feb 2026| IDR bn | FY21 | FY22 | FY23 | FY24 | FY25 |
|---|---|---|---|---|---|
| PPP ROA | 3.35% | 3.42% | 3.32% | 3.10% | 2.75% |
| ROA | 1.2% | 1.8% | 2.0% | 1.9% | 1.6% |
| ROE | 9.9% | 15.0% | 15.2% | 14.0% | 12.2% |
| Equity/Assets | 12.07% | 12.32% | 13.61% | 14.14% | 12.44% |
| CET1 Ratio | 17.4% | 17.5% | 20.2% | 18.9% | 18.4% |
| NPL Ratio | 3.70% | 2.81% | 2.14% | 1.97% | 1.94% |
| Provisions/Average Loans | 3.23% | 1.83% | 1.41% | 1.08% | 1.21% |
| LDR | 79.9% | 84.0% | 85.7% | 96.3% | 86.4% |
CreditSight View Comment
AS OF 06 Feb 2026BNI is the 4th largest bank in Indonesia by assets and is 60% government owned. Asset quality was weaker than Mandiri, but has improved on its pivot to better quality segments since ’21. Funding cost pressure from the tight liquidity environment has eased with recent government stimulus, and loan growth has picked up. Margins though are under pressure from state-subsidized lending programs and rate cuts impacting wholesale lending yields. Soft economic momentum, retail asset quality strains and higher governance risks are also headwinds. Fundamentals however remain sound with a corporates focused book, strong capital and decent profitability. We expect capital ratios to decline, but would be fine with a 14-16% CET1 ratio. We have BNI on U/P due to Indonesia’s macro uncertainty overhang.
Recommendation Reviewed: February 06, 2026
Recommendation Changed: August 04, 2025
Featured Issuers
Perusahaan Listrik Negara
Hyundai Motor
Republic of the Philippines
How may we help you?
Search topics about wealth insights and investments.Kasikornbank
- Sector: Financial Services
- Sub Sector: Banks
- Region: Thailand
- Bond: KBANK 5.458 28
- Indicative Yield-to-Maturity (YTM): 4.77%
Access this content:
If you are an existing investor, log in first to your Metrobank Wealth Manager account.
If you wish to start your wealth journey with us, click the “How To Sign Up” button.
Fundamental View
AS OF 24 Feb 2026Kasikornbank (KBANK) is a historically sound and profitable bank.
Capitalisation is strong and the bank has among the highest CASA ratios in the banking sector. Asset quality took a surprise turn for the worse in 4Q22 due to its larger SME exposure and the bank has since focused on de-risking its portfolio. Credit costs are improving but remain elevated.
Margins are high compared to most other Thai banks we cover as a result of its strong SME franchise, but the shift in growth focus to the safer but lower yielding segments has diminished its margin lead.
Business Description
AS OF 24 Feb 2026- KBank is currently the second largest bank in Thailand. It briefly was the largest from 2018 until mid-2020, upon which Bangkok Bank completed its acquisition of Indonesia's Bank Permata and took its place.
- KBank's history can be traced back to 1945 when it was first established as Thai Farmers Bank. It was listed on the Stock Exchange of Thailand in 1976 and changed its name to Kasikornbank in 2003.
- As of December 2025, the bank's loan mix by segment consists of 41% corporate, 24% SME, 31% retail and 4% others.
- KBank is known for its strong SME franchise. It also partially owns a life insurance company, Muang Thai Life.
Risk & Catalysts
AS OF 24 Feb 2026Thai economic growth is expected to slowdown this year from US tariffs. Ripple effects are in the form of lower bank NIMs as more BOT rate cuts come through to support growth, and credit costs remaining relatively elevated. Moody’s and Fitch have downgraded their rating outlook on the Thailand sovereign (and consequently the Thai banks including KBANK at Moody’s, which it currently rates in line with the sovereign) to negative in April and September 2025 respectively on increased risks to Thailand’s economic and fiscal strength.
We see still middling loan growth across the Thai banks due to a focus on quality amid the current backdrop. Trading/investment income is also set to moderate from a high base given a smaller rates tailwind this year, while KBANK’s switch to focus on safer segments will continue to weigh on the NIM.
KBANK has a higher retail/SME loan mix and sizable restructured loans portfolio (~8.8% of total loans). FY26 guidance for credit costs have as such remained in an elevated range of 140-160 bp as we had expected, but KBANK’s higher NIM and low-40%s cost-income ratio provide comfortable room for that to be absorbed.
Key Metric
AS OF 24 Feb 2026| THB mn | FY21 | FY22 | FY23 | FY24 | FY25 |
|---|---|---|---|---|---|
| PPP ROA | 2.38% | 2.36% | 2.52% | 2.64% | 2.47% |
| ROA | 0.98% | 0.86% | 0.99% | 1.15% | 1.11% |
| ROAE | 8.3% | 7.3% | 8.2% | 9.0% | 8.6% |
| Equity / Assets | 13.1% | 13.4% | 13.9% | 14.9% | 14.8% |
| CET1 Ratio | 15.5% | 15.9% | 16.5% | 17.4% | 18.0% |
| Gross NPL ratio | 3.76% | 3.19% | 3.19% | 3.20% | 3.20% |
| Provisions / Loans | 1.73% | 2.11% | 2.08% | 1.90% | 1.63% |
| Gross LDR | 93% | 91% | 92% | 91% | 87% |
| Liquidity Coverage Ratio | 174% | 164% | 195% | 184% | n/m |
CreditSight View Comment
AS OF 22 Jan 2026Kasikornbank is the 2nd largest bank in Thailand. We are cautious about its one quarter loan book exposure to SMEs given the macro backdrop; credit costs spiked in 4Q22 mainly from the SME book and high yield small ticket lending, and the restructured loan book remains sizable. The bank however has switched to focus on safer segments, which is weighing on the historically high NIM but helped to stabilize credit costs. Credit costs remain fairly elevated but comfortably absorbed thus far. Capital is high with CET1 at ~18%. The NIM though is on a decline from lower rates, safer new loans, higher parking of funds in liquidity. We see a meaningful US tariff impact, with ripple effects in the form of lower bank NIMs and credit costs staying fairly elevated. We have an Underperform rec.
Recommendation Reviewed: January 22, 2026
Recommendation Changed: April 22, 2025
Featured Issuers
Perusahaan Listrik Negara
Hyundai Motor
Republic of the Philippines