Technical Analysis: Is AI driving irrational behavior in the S&P 500?
Technical signals amid the global economic backdrop call for risk management.

The US stock indices reached critical resistance levels following the month-long push triggered by artificial intelligence, or AI, after the resolution of the US debt crisis. Hitting these levels opens up the opportunity for profit taking amid high interest rates, slowing global growth, and lingering inflationary pressures.
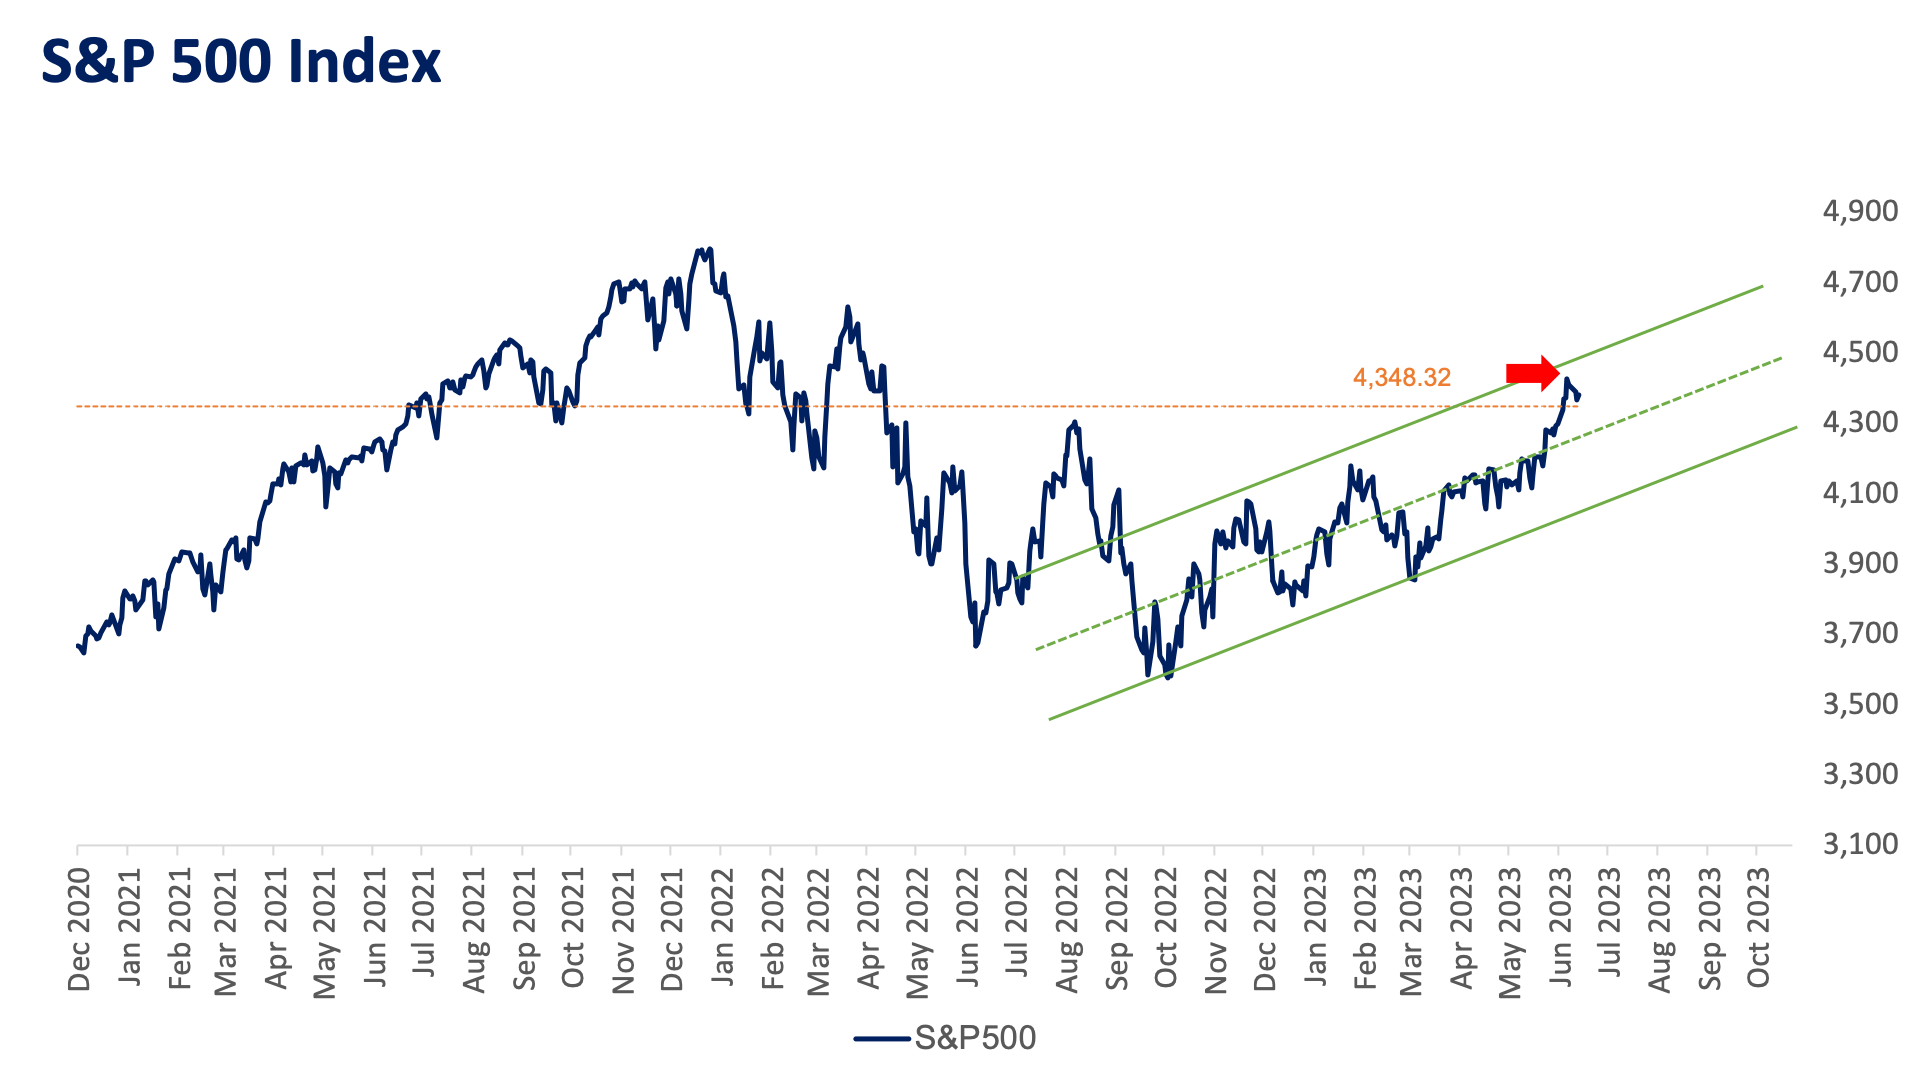
Hitching on the AI bandwagon: Things are looking up in the markets, or so it seems.
Over the past month, roughly 10 mega-cap technology stocks have lifted US markets as the “AI euphoria” continued. The herding phenomenon in markets has triggered a “FOMO” mentality in the AI space with the launch of ChatGPT.
Despite hitting key resistance levels, US markets remain “bullish” in the short to medium term with the VIX (fear index) recording 13.4, the lowest seen since before the COVID pandemic.
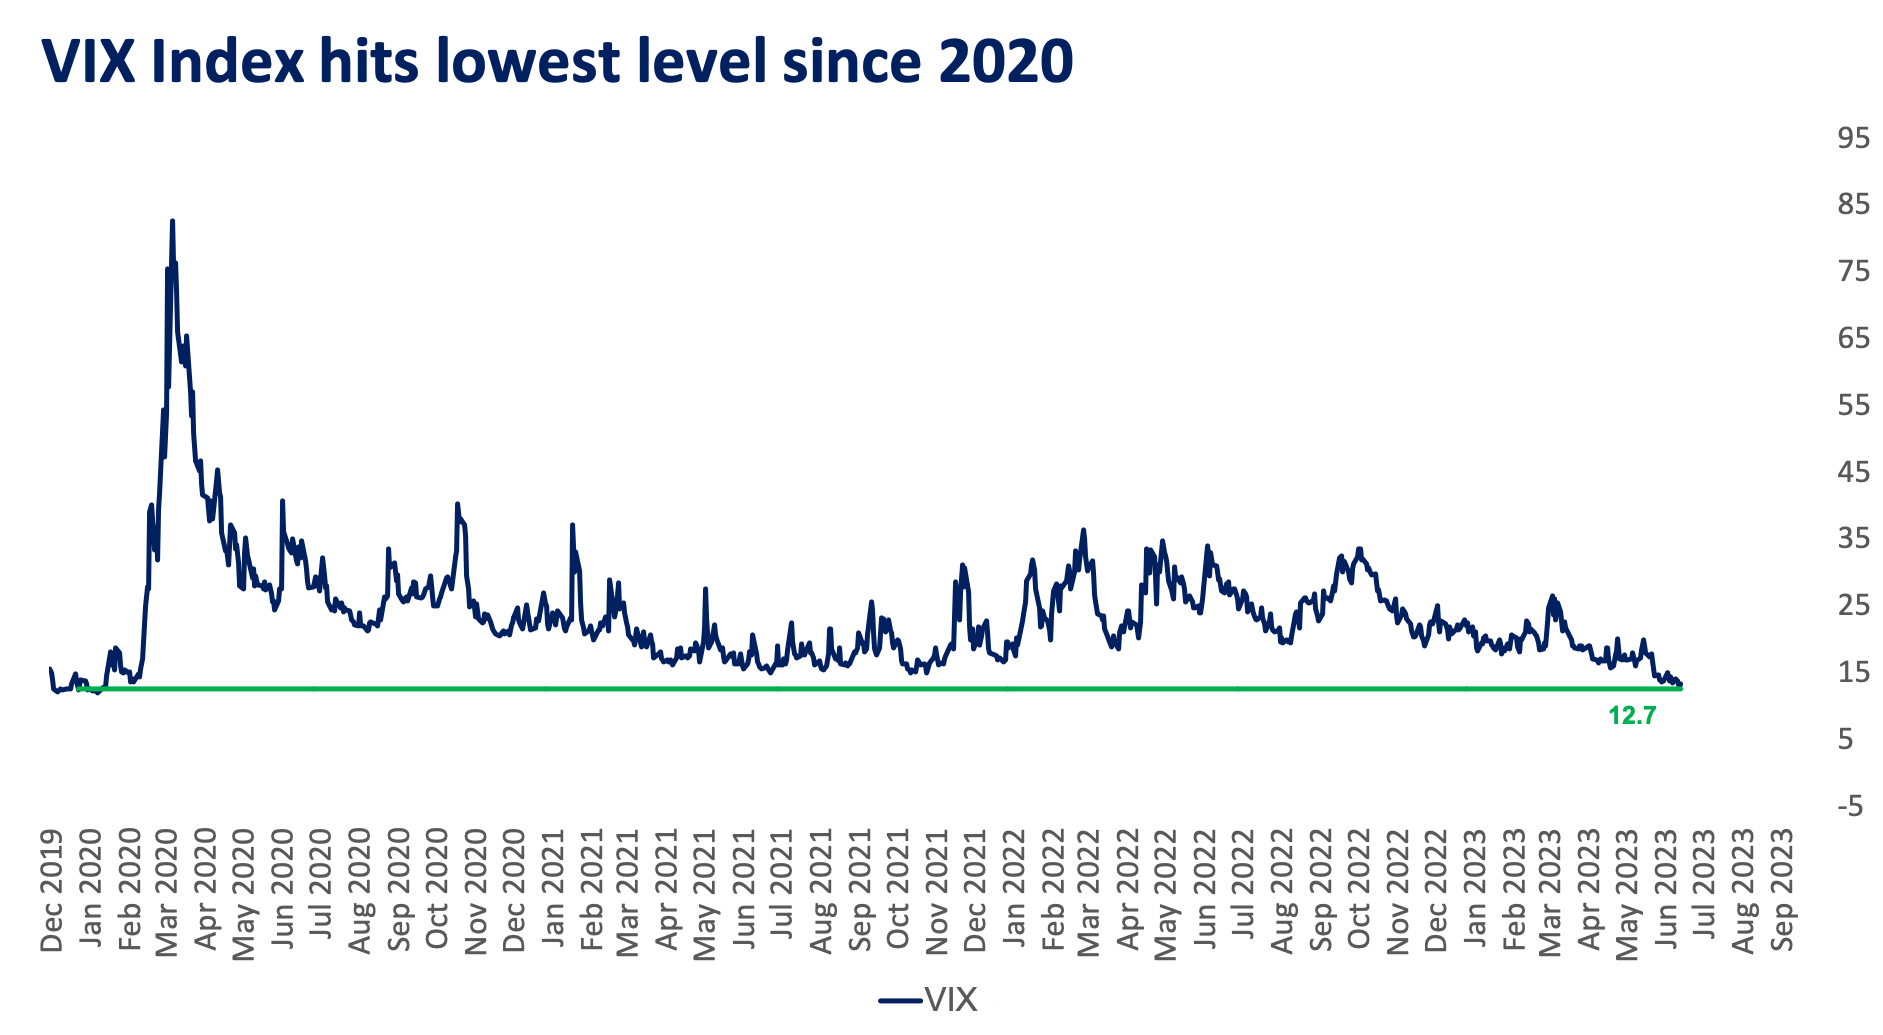
No fear except the fear of missing out in the markets.
This FOMO has triggered markets to enter a new stage of “complacency,” with the recent run-up being one of the fastest since 2004 and the build-up to the 2000 tech bubble.
A deeper look into the S&P 500 tells us that:
- US markets are bullish – looking at “arrow A” we can easily identify higher highs and higher lows, forming an up-trending channel.
- The market’s rally is extended – the run-up since the resolution of the debt crisis was too fast and a correction or pause is needed.
- The S&P will likely retest the support – the S&P500 has recently bounced-off the 4,420-resistance level and likely to re-test the 4,300 support “Line B”.
- Momentum confirms price action – Momentum has also reached a resistance level “line C” and also indicates a temporary decline in the short term.
- Weak market breadth – the FOMO induced by AI has made this rally very top heavy and highly vulnerable to exhaustion.
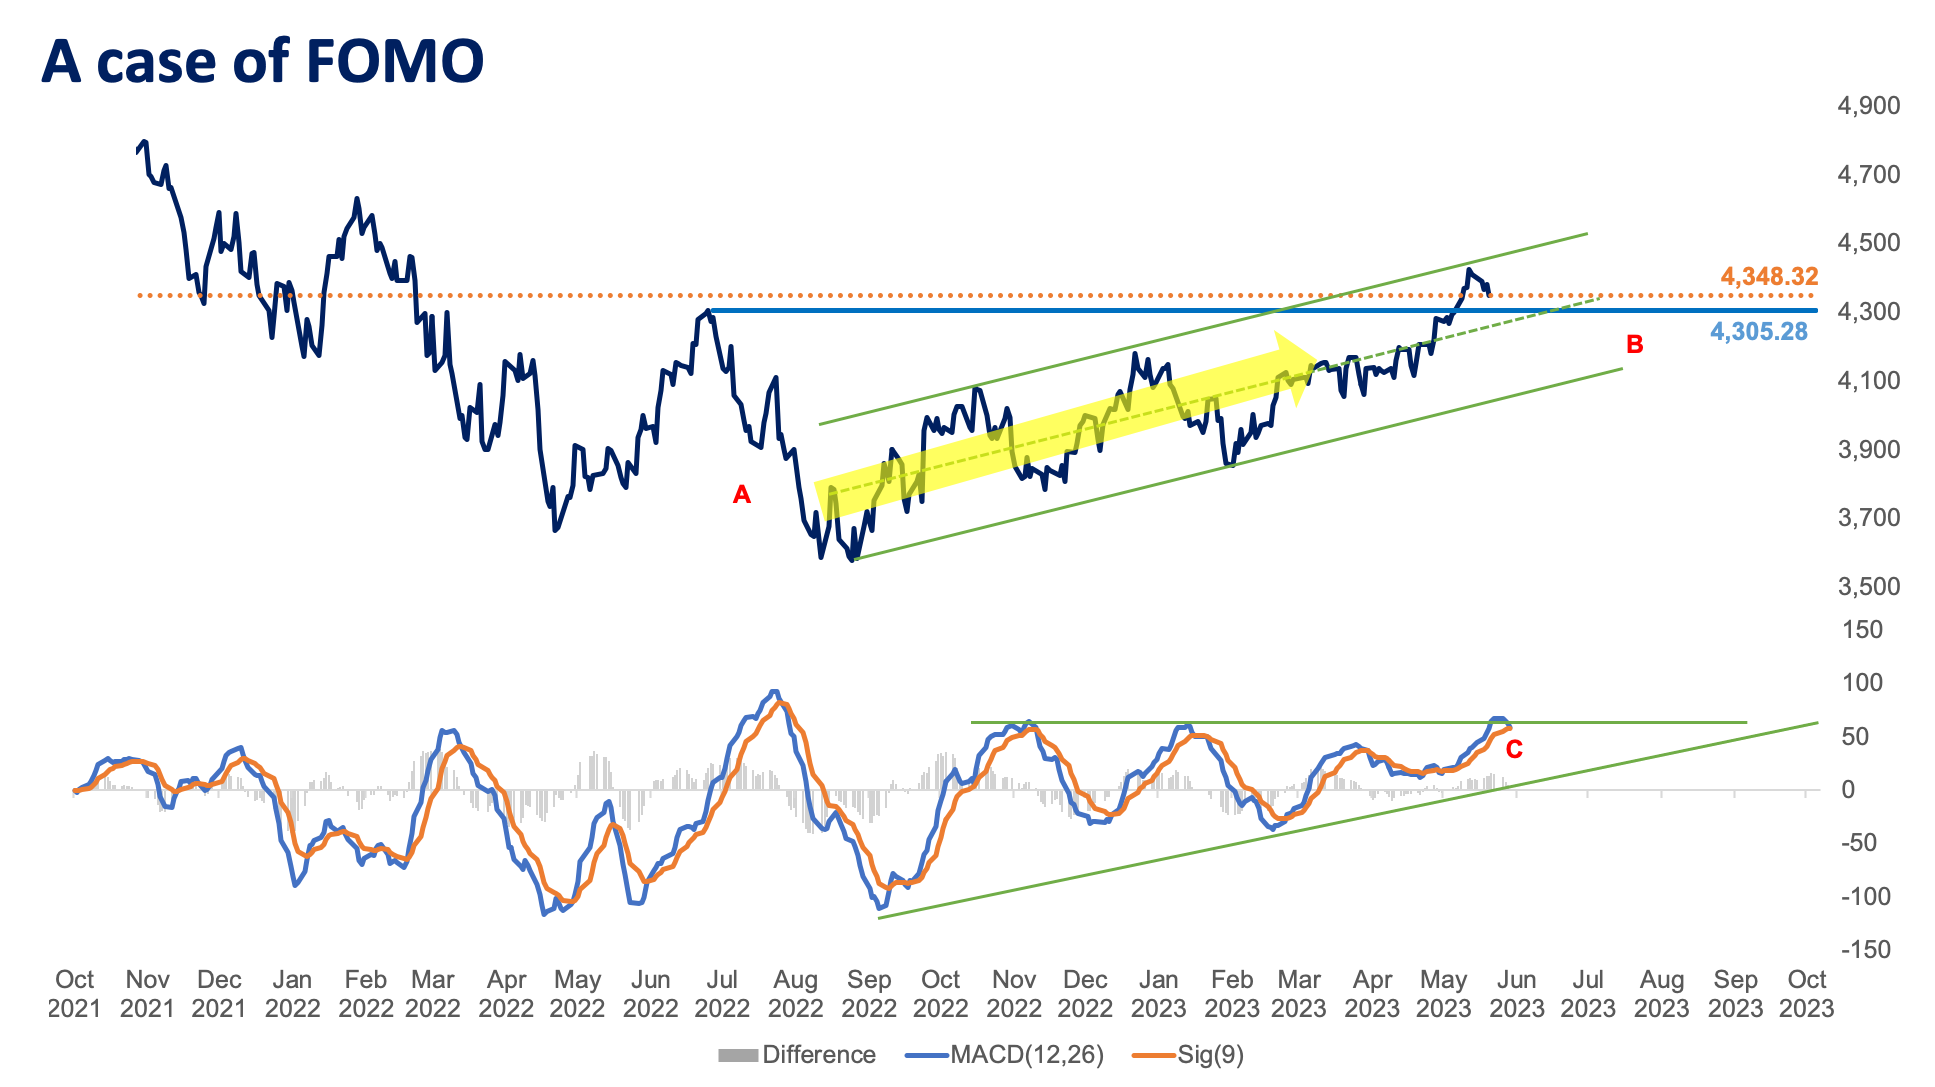
The arrow A represents the bullishness in the S&P 500, while line B is the support line which may likely be retested amid the backdrop of optimism. The momentum also seems to have reached a peak as shown by line C, suggesting a temporary decline in the short term.
Wrap-up
Due to the irrational behavior of markets, it is unknown how long this rally will last as no long-term sell signal has yet to be identified. If the price were to break above the 4,420-resistance level, the S&P 500 opens up to re-testing the all-time high of 4,800, which was last seen in January 2022.
Considering the uncertain global economic backdrop and technical signals, taking into account risk management, taking small profits, or the reduction of market risk may be advisable given the strong run-up we have already seen.
US markets may have entered a “technical bull market” as it rose 20% from the 2022 lows, but underlying indicators are showing biases to market tops rather than market bottoms.
KYLE TAN is an Investment Officer at Metrobank’s Trust Banking Group, managing the bank’s offshore Unit Investment Trust Funds (UITF). He holds a master’s degree in financial engineering from the De La Salle University and is a Level 2 passer of the Chartered Market Technician (CMT) certification course. He spends his free time working out, training at the gun range, or hunting for rare Star Wars collectibles.





 DOWNLOAD


 By Kyle Tan