Technical Analysis: Global economy needs a check-up with Dr. Copper
Are copper prices telling us something about global economic growth in 2024? Some charts may offer clues.

Copper is often referred to as “Dr. Copper” because of its ability to predict the direction of the global economy. Don’t believe me? Take a moment to observe your surroundings and identify items that may contain copper. Even the device you are using to read this contains copper.
Modern society heavily relies on this metal. It is affordable and versatile and can be used in construction, electronics, transportation, and more. When the economy is in expansion, the demand for this commodity rises, driving prices upward.
Conversely, during an economic contraction, demand decreases, causing prices to fall. Because copper is an essential component at the start of the supply chain, it serves as a reliable leading economic indicator.
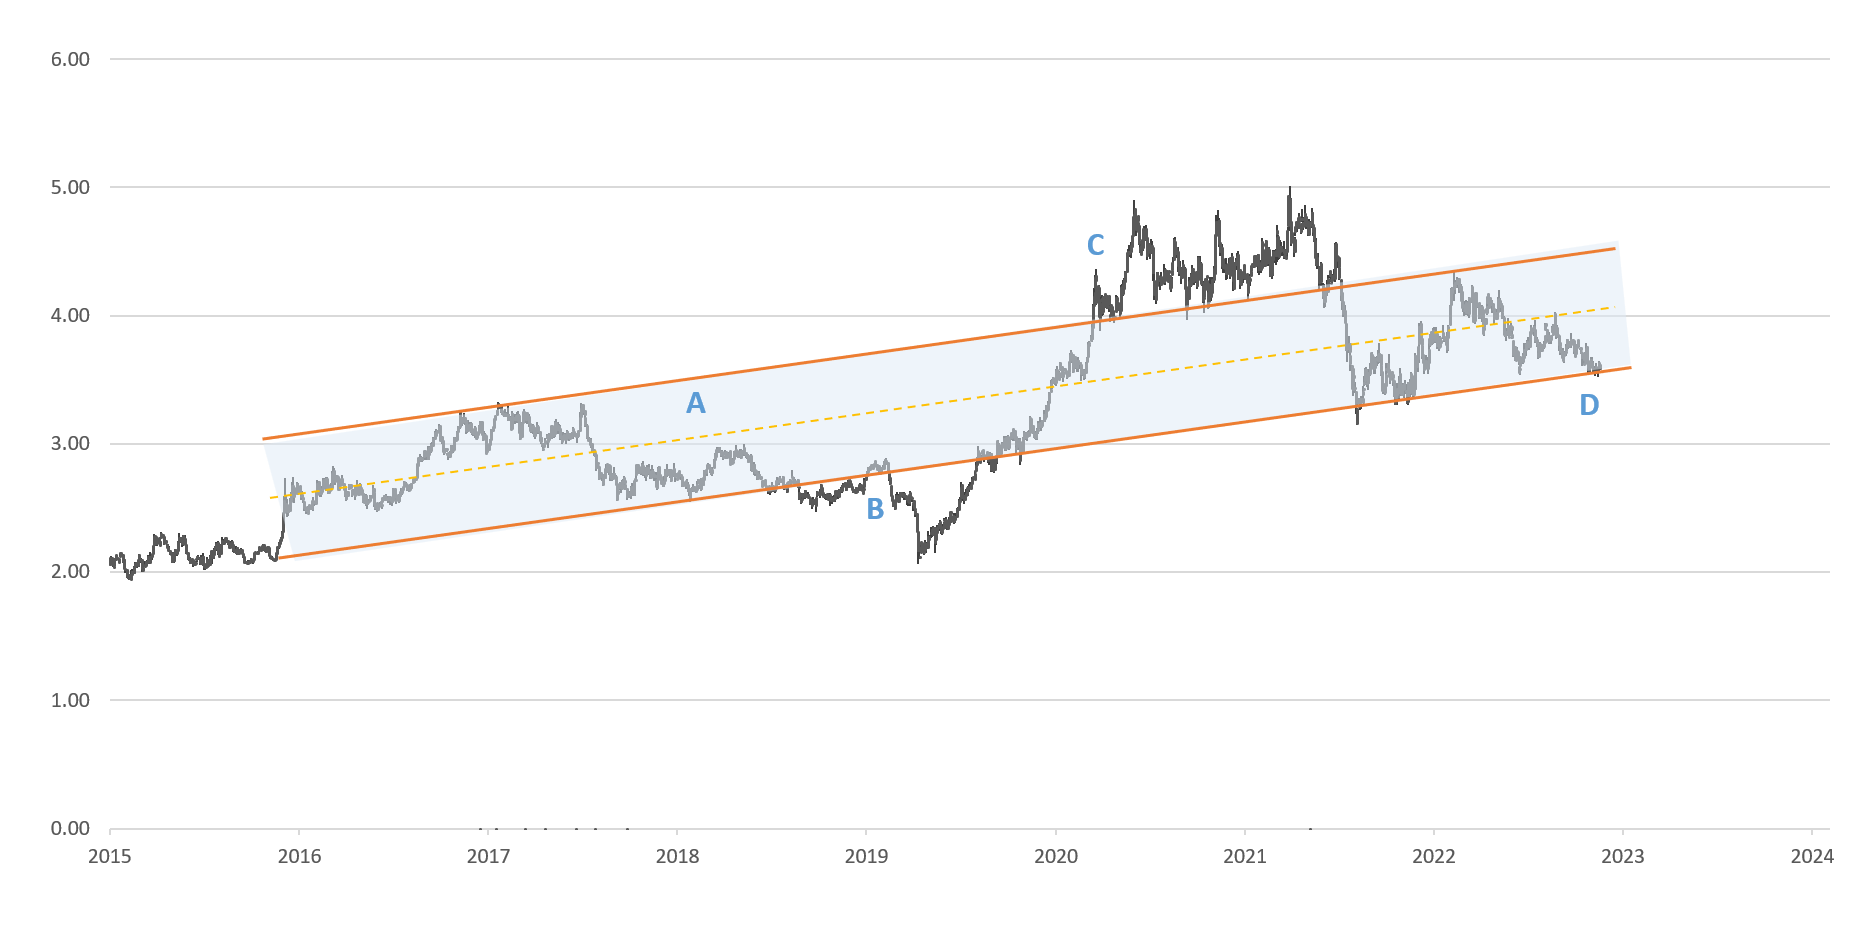
Long-term movement of copper
A. Since 2017, a long term up-trend has been established, with normal fluctuation within the range.
B. In 2019, copper fell below the trend line as the central bank hiked rates aggressively in 2017 and 2018, triggering the inversion (A recession signal) of the US 10-year and 2-year yields. The following year, the COVID-19 pandemic hit, prompting the swift collapse of growth and the commodity.
C. As quick as copper fell during the pandemic, loose monetary policy, stimulus, and supply chain issues pushed copper prices to all-time-highs as demand for electronics skyrocketed as people were forced to work-from-home and study-from-home.
D. Copper is currently at the long-term support level following the US Fed’s most aggressive hiking cycle in four decades.
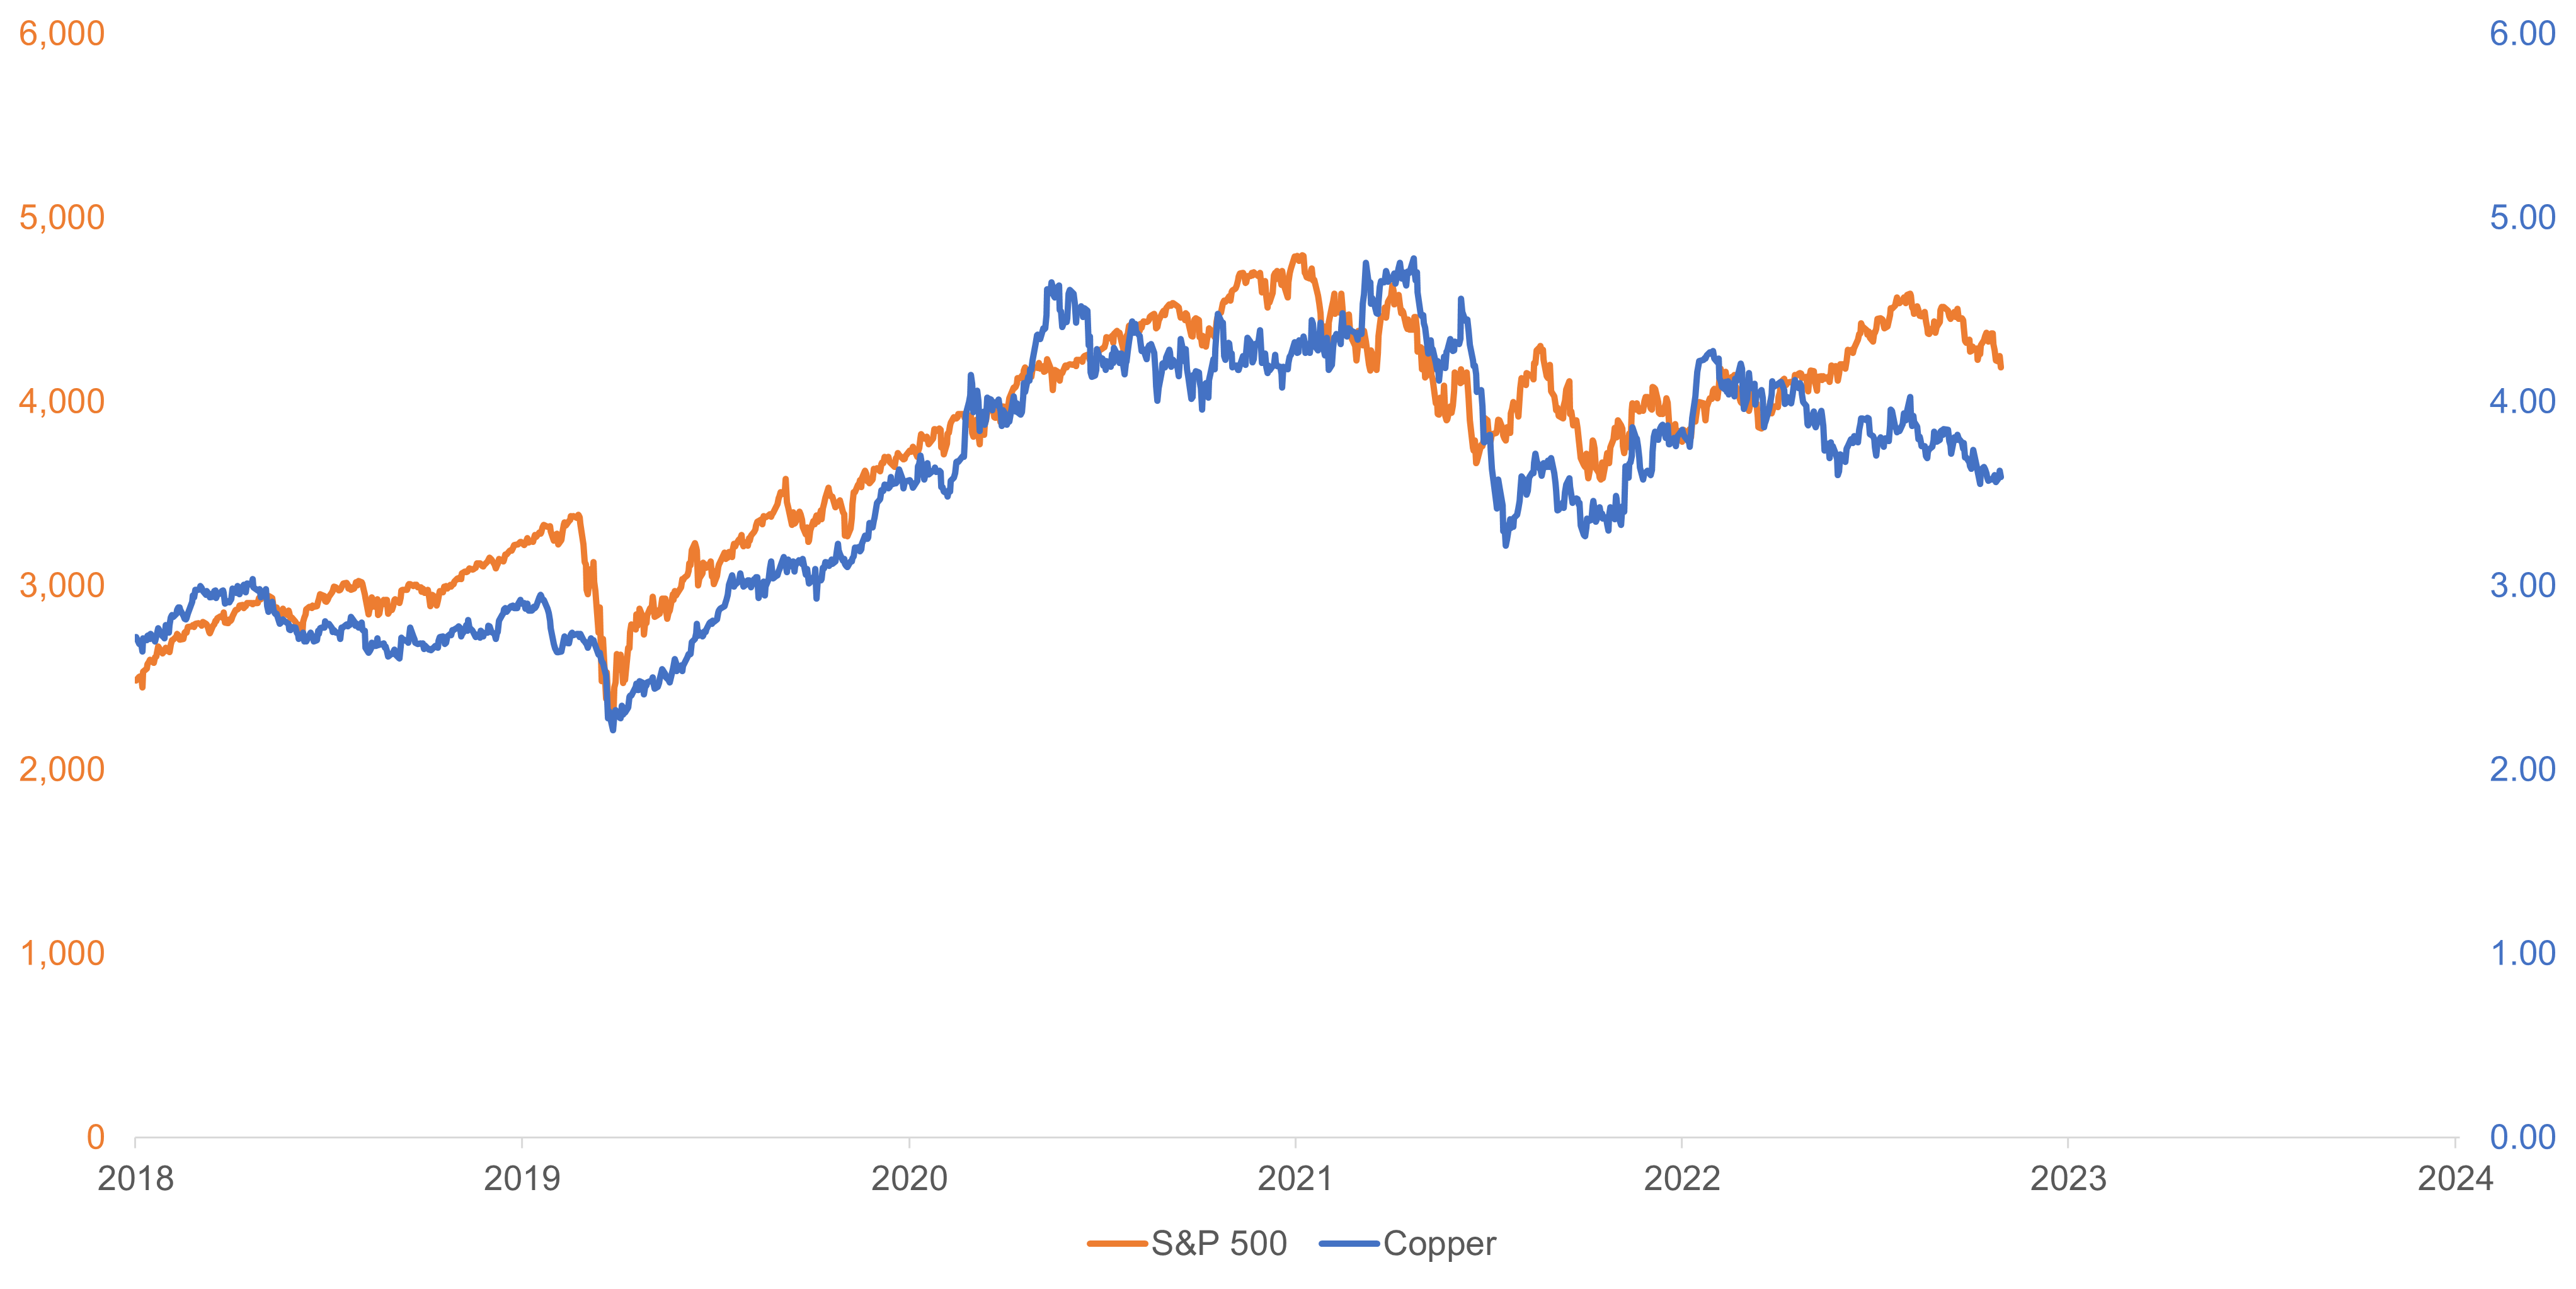
The movement of the S&P 500 and copper appears to show that copper leads equity markets by three months.
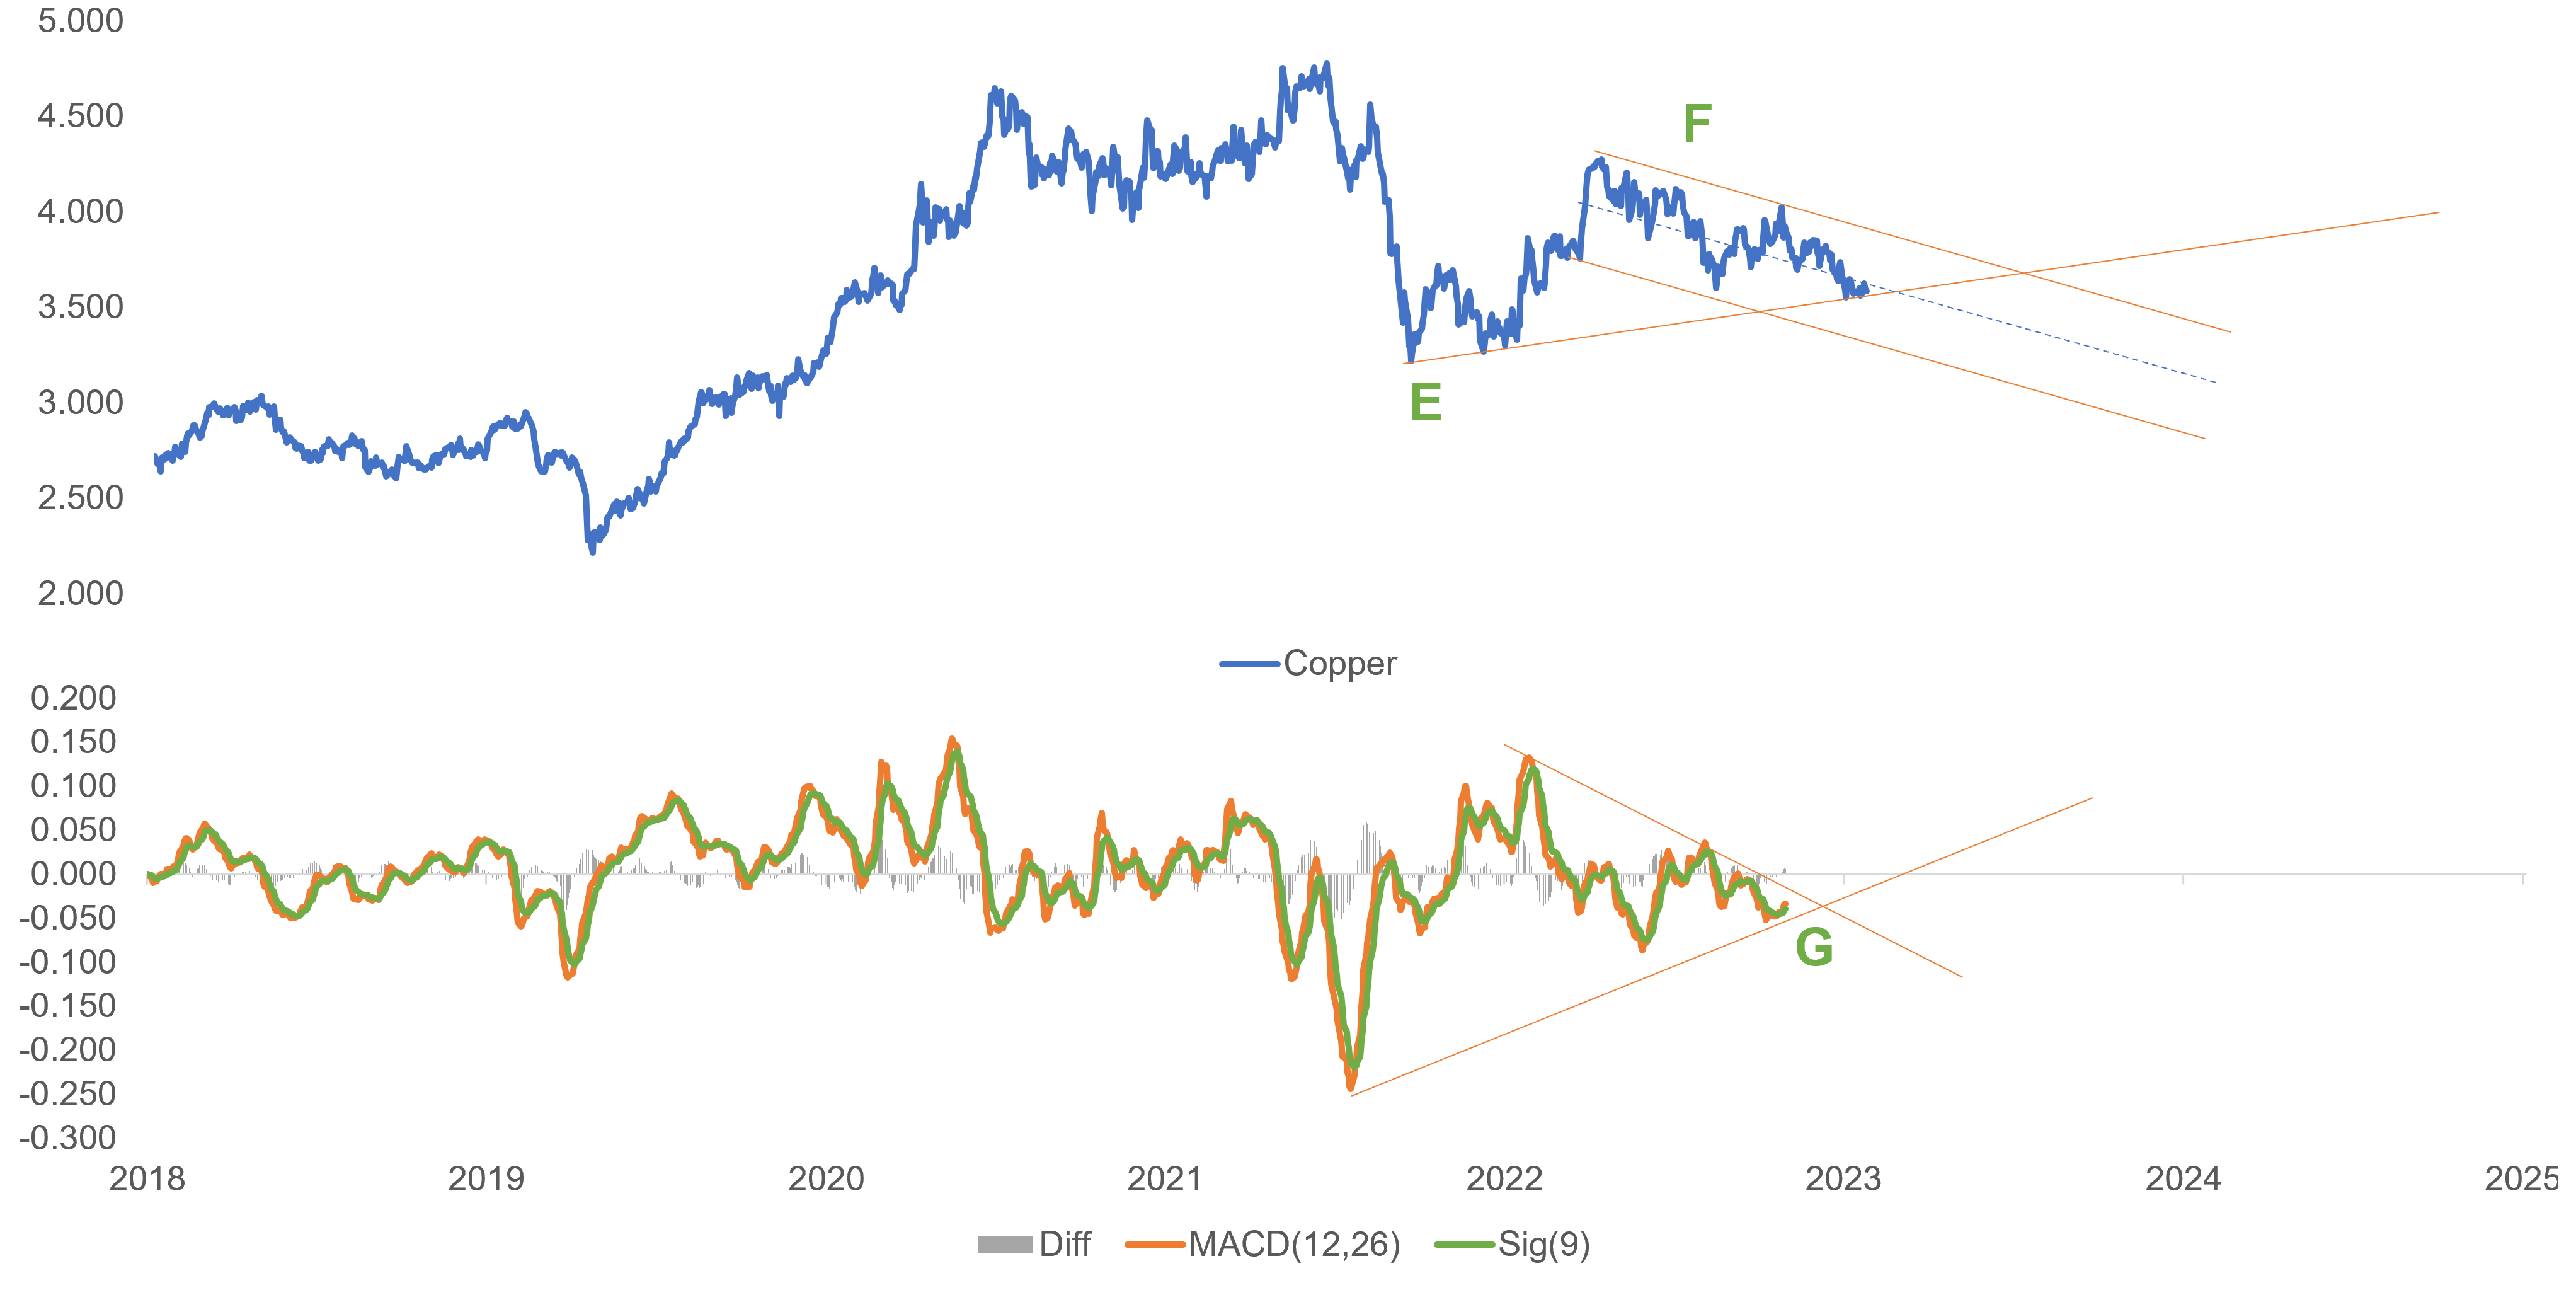
Short-term movement of copper
E. From the October 2022 lows (also seen in the US equity markets), copper has made a rally from USD 3.2 to a high of USD 4.2 before returning to its medium-term support of USD 3.5.
F. In 2023, a downtrend can be seen as the weak post-COVID-19 re-opening of China, the stagnating economy of Europe, and the high interest rate environment add to growth uncertainties heading into 2024.
G. The price momentum indicates limited upside at USD 3.90.
Takeaway
Copper performs exceptionally well when the global economy emerges from a recession, but it tends to struggle when entering an economic slump.
An analysis of both long- and short-term charts reveals that copper is currently trading near crucial support levels. At current levels, it would be best to stay cautious and wait for the momentum point (G) to break above or break below its trading range.
A breach below the USD 3.5 level for this brownish metal could serve as a significant warning sign for the trajectory of global growth in 2024.
KYLE TAN is an Investment Officer at Metrobank’s Trust Banking Group, managing the bank’s offshore Unit Investment Trust Funds (UITFs). He holds a Master’s degree in Financial Engineering from the De La Salle University and is a Level 2 passer of the Chartered Market Technician (CMT) certification course. He spends his free time working out, training at the gun range, or hunting for rare Star Wars collectibles.





 DOWNLOAD




 By Kyle Tan