Taming the lingering inflation in the US
Nudging inflation down to an acceptable level through the US Fed’s policy rates can take a year or two. Watching the key components of inflation can help hone forecasts.
A growing economy naturally results in inflation. As the demand for goods and services increases, the pressure on the supply of these goods and services also increases. The result is inflation.
However, too much inflation is also not good. It curbs demand and economic activity, dampening economic growth. Just the right level of inflation, in this case, 2%, is the target in the US. It is actually the same here in the Philippines.
Right now, inflation in the US is still above 2%, and there is no telling when the rise in prices will finally slow down. How did the US get itself into this situation?
It all started during the COVID-19 pandemic. The crisis has forced governments to implement restrictions on mobility to reduce the spread of the virus, thereby limiting economic activity in the process.
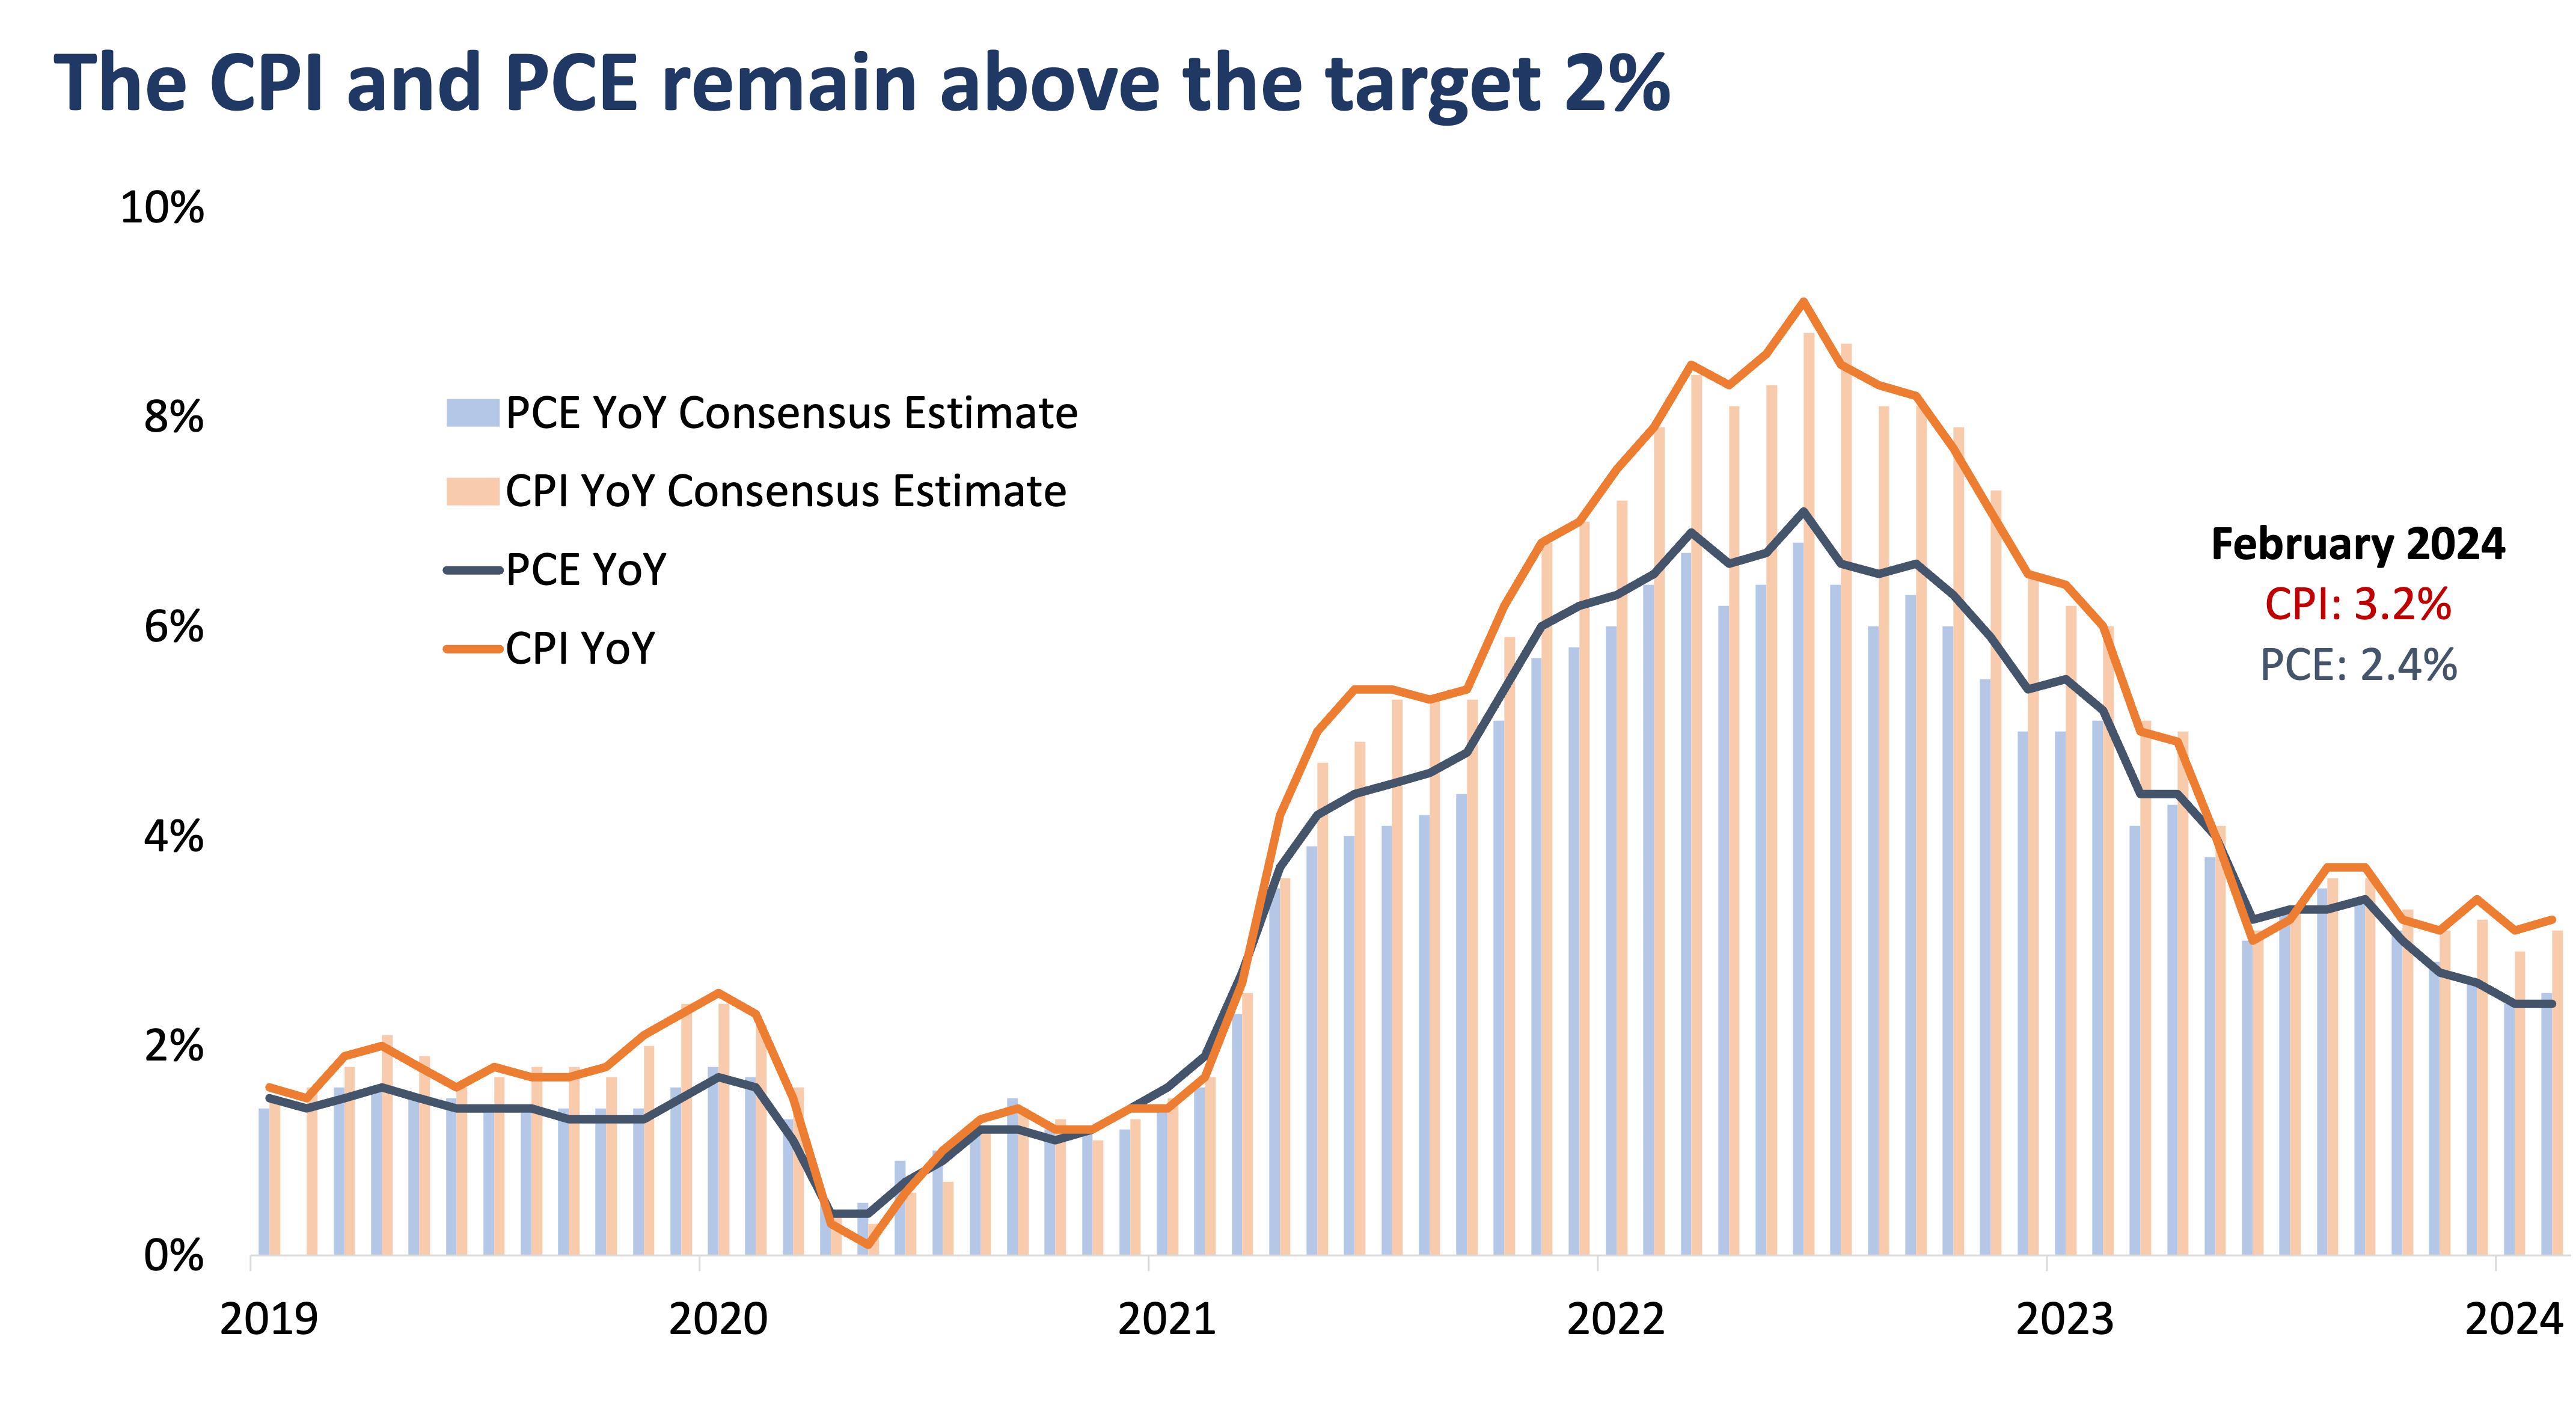
In 2020, the US economy started to recover with a 3.6% economic growth in the third quarter, up from a contraction of 1.4% in the previous quarter. Despite the economic recovery, inflation increased continuously, as evidenced by the Consumer Price Index (CPI) and Personal Consumption Expenditure (PCE) price index, with their peak reaching 9.1% and 7.1%, respectively.
Two measures of US inflation
Two popular measures of inflation are the Consumer Price Index (CPI) of the Bureau of Labor Statistics and the Personal Consumption Expenditure (PCE) price index of the Bureau of Economic Analysis.
The US government and the market monitor both inflation measures, but the PCE is the preferred inflation gauge of the Federal Reserve as it includes a more comprehensive coverage of goods and services and takes into consideration more people’s spending behavior.
When the US economy started recovering in 2020 during the pandemic, prices started to rise with the acceleration of demand for goods, energy, and shelter. As shown in the table below, inflation has reached its peak, with the CPI and PCE reaching 9.1% and 7.1% year-on-year in June 2022, respectively.
Prices have slowed down since but remained elevated. The latest inflation print in February showed an acceleration of 3.2% and 2.4% year-on-year for CPI and PCE, respectively.
Inflation components
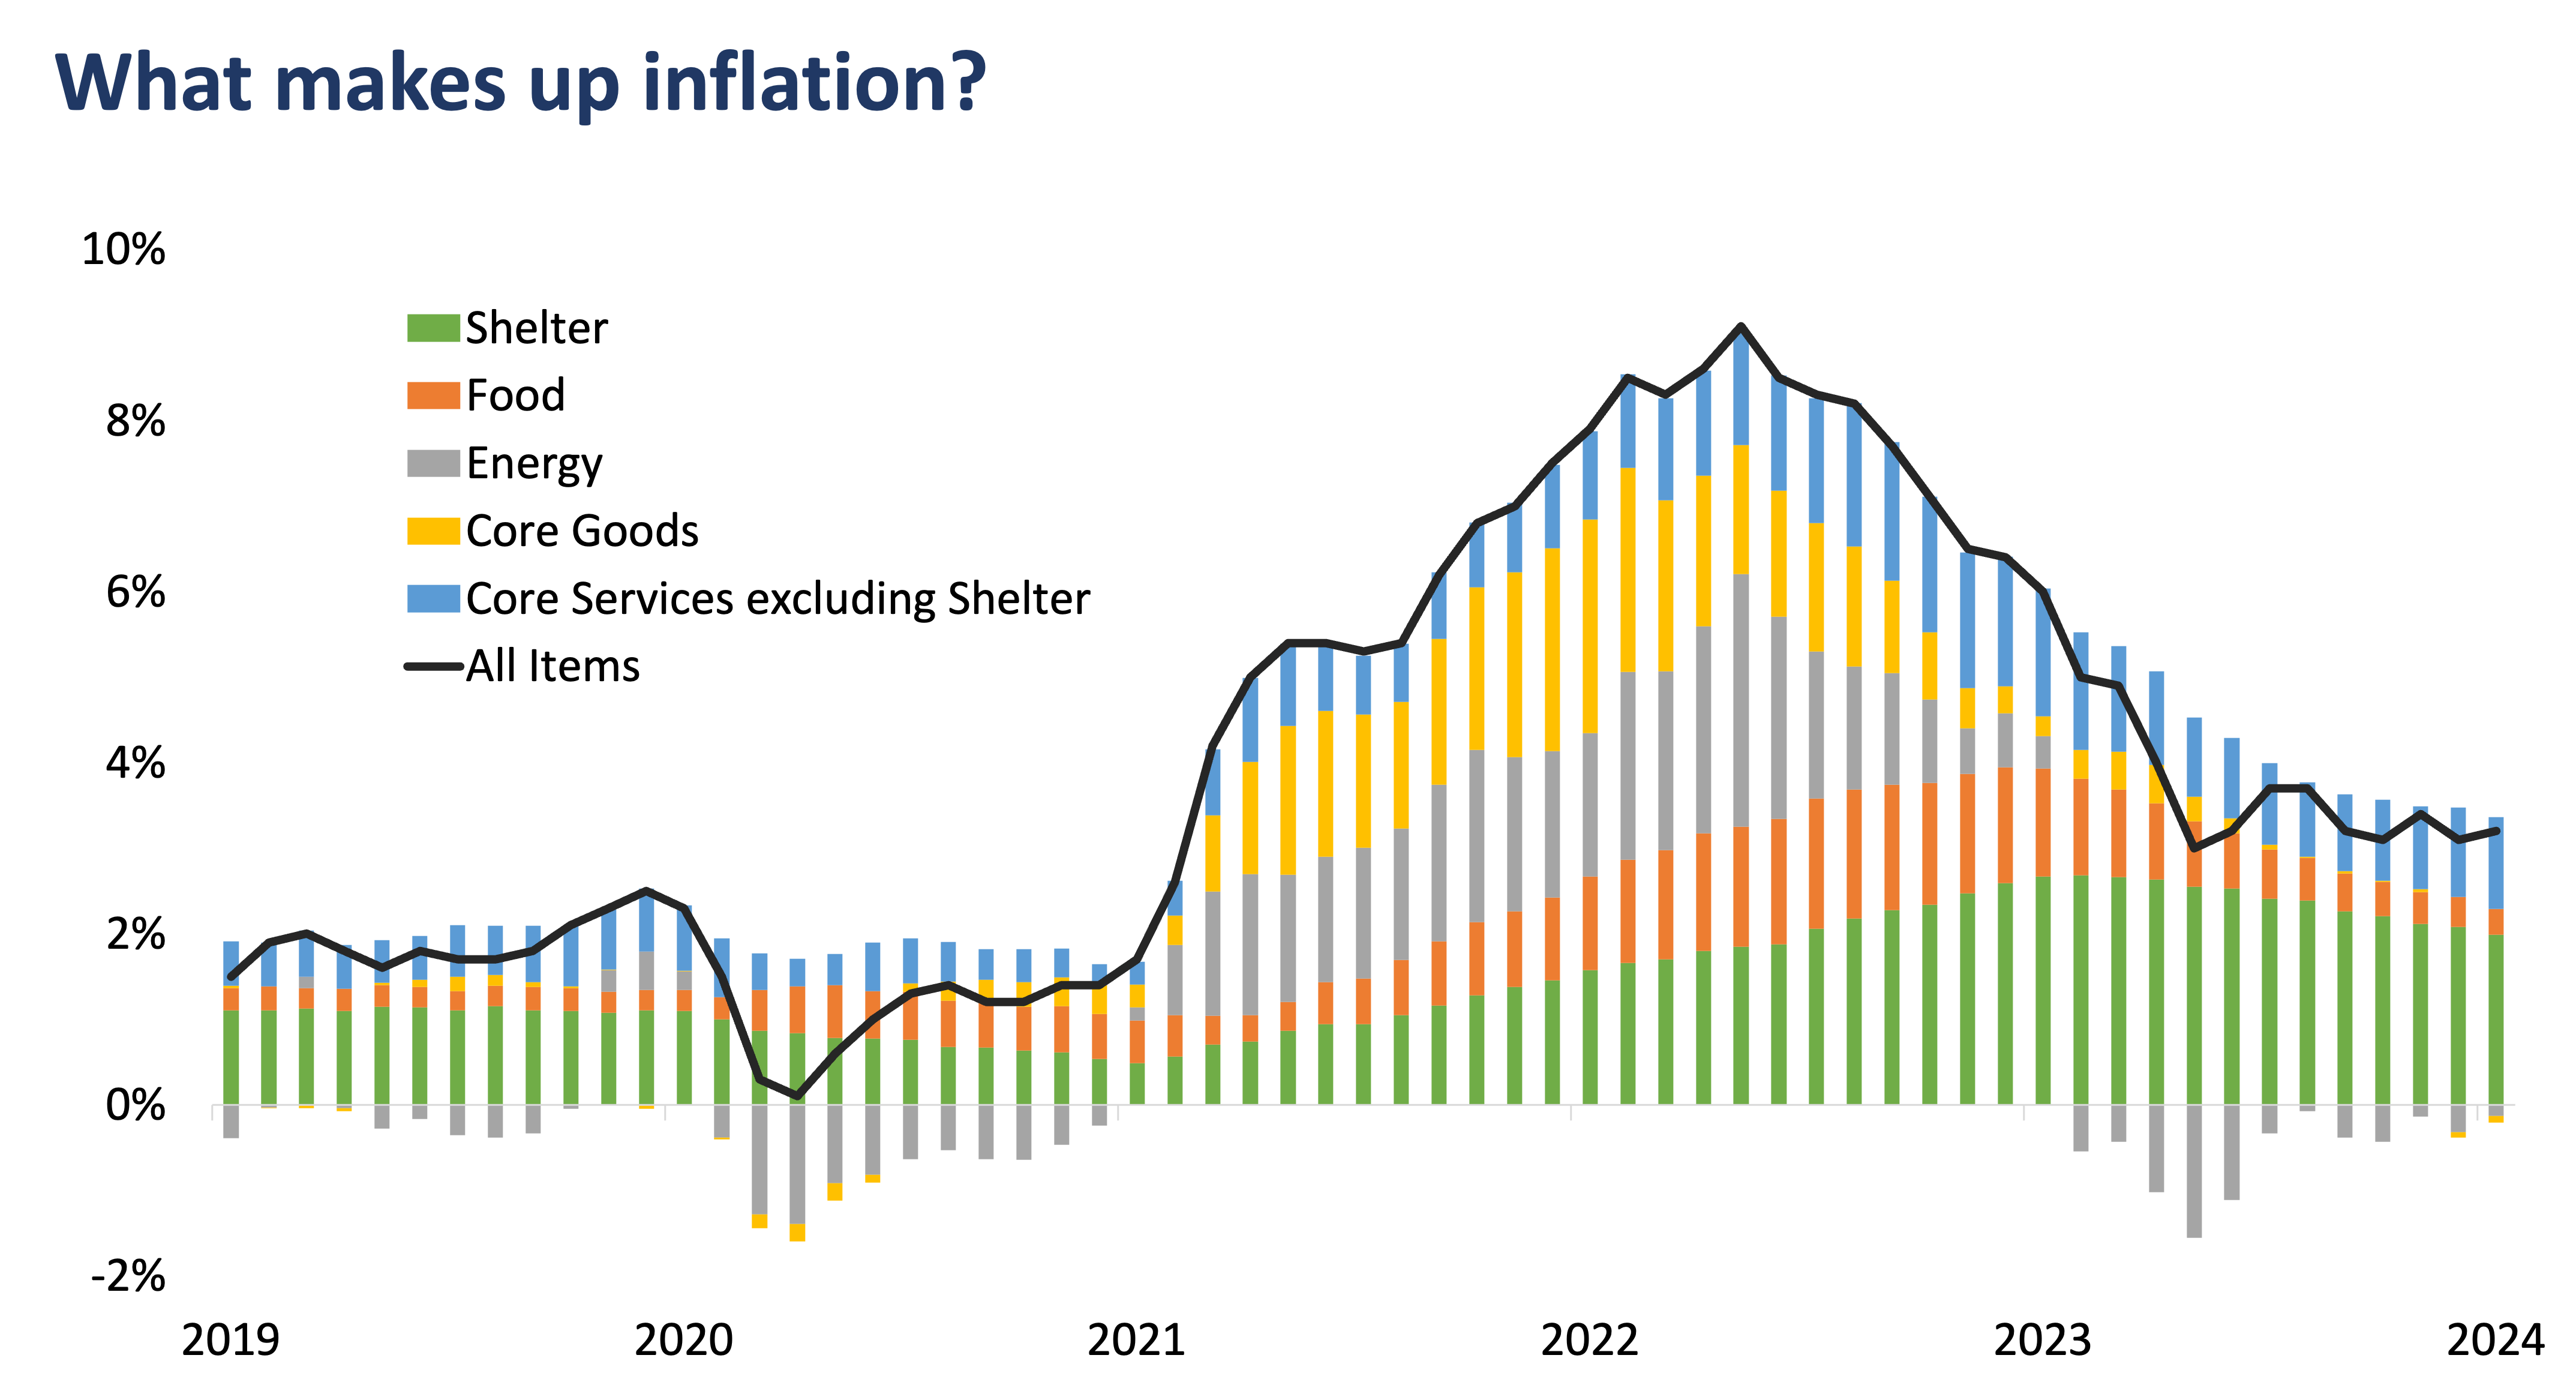
While inflation gradually fell after its peak in 2022, prices have remained elevated because of the acceleration of the prices of services. Core goods, food, and energy prices have already been tamed back to pre-pandemic levels, but core services, which include shelter, remained high.
In the CPI print in February 2024, 3.06% of the 3.2% inflation was attributed to core services. Shelter inflation has slowed down but remains the main driver, as it contributes to the majority of the total inflation with its latest contribution of 1.99%. The table below shows the breakdown of CPI.
Without shelter, the CPI decreased from its peak in July 2022 until June 2023, when it suddenly accelerated from 0.7% year-on-year to 1.0% in July. Meanwhile, shelter prices continued to accelerate until March 2023 and have been on a downward trajectory since.
In fact, without shelter, the CPI has already reached the 2.0% inflation target of the Federal Reserve in July 2023 and has remained within that range since.
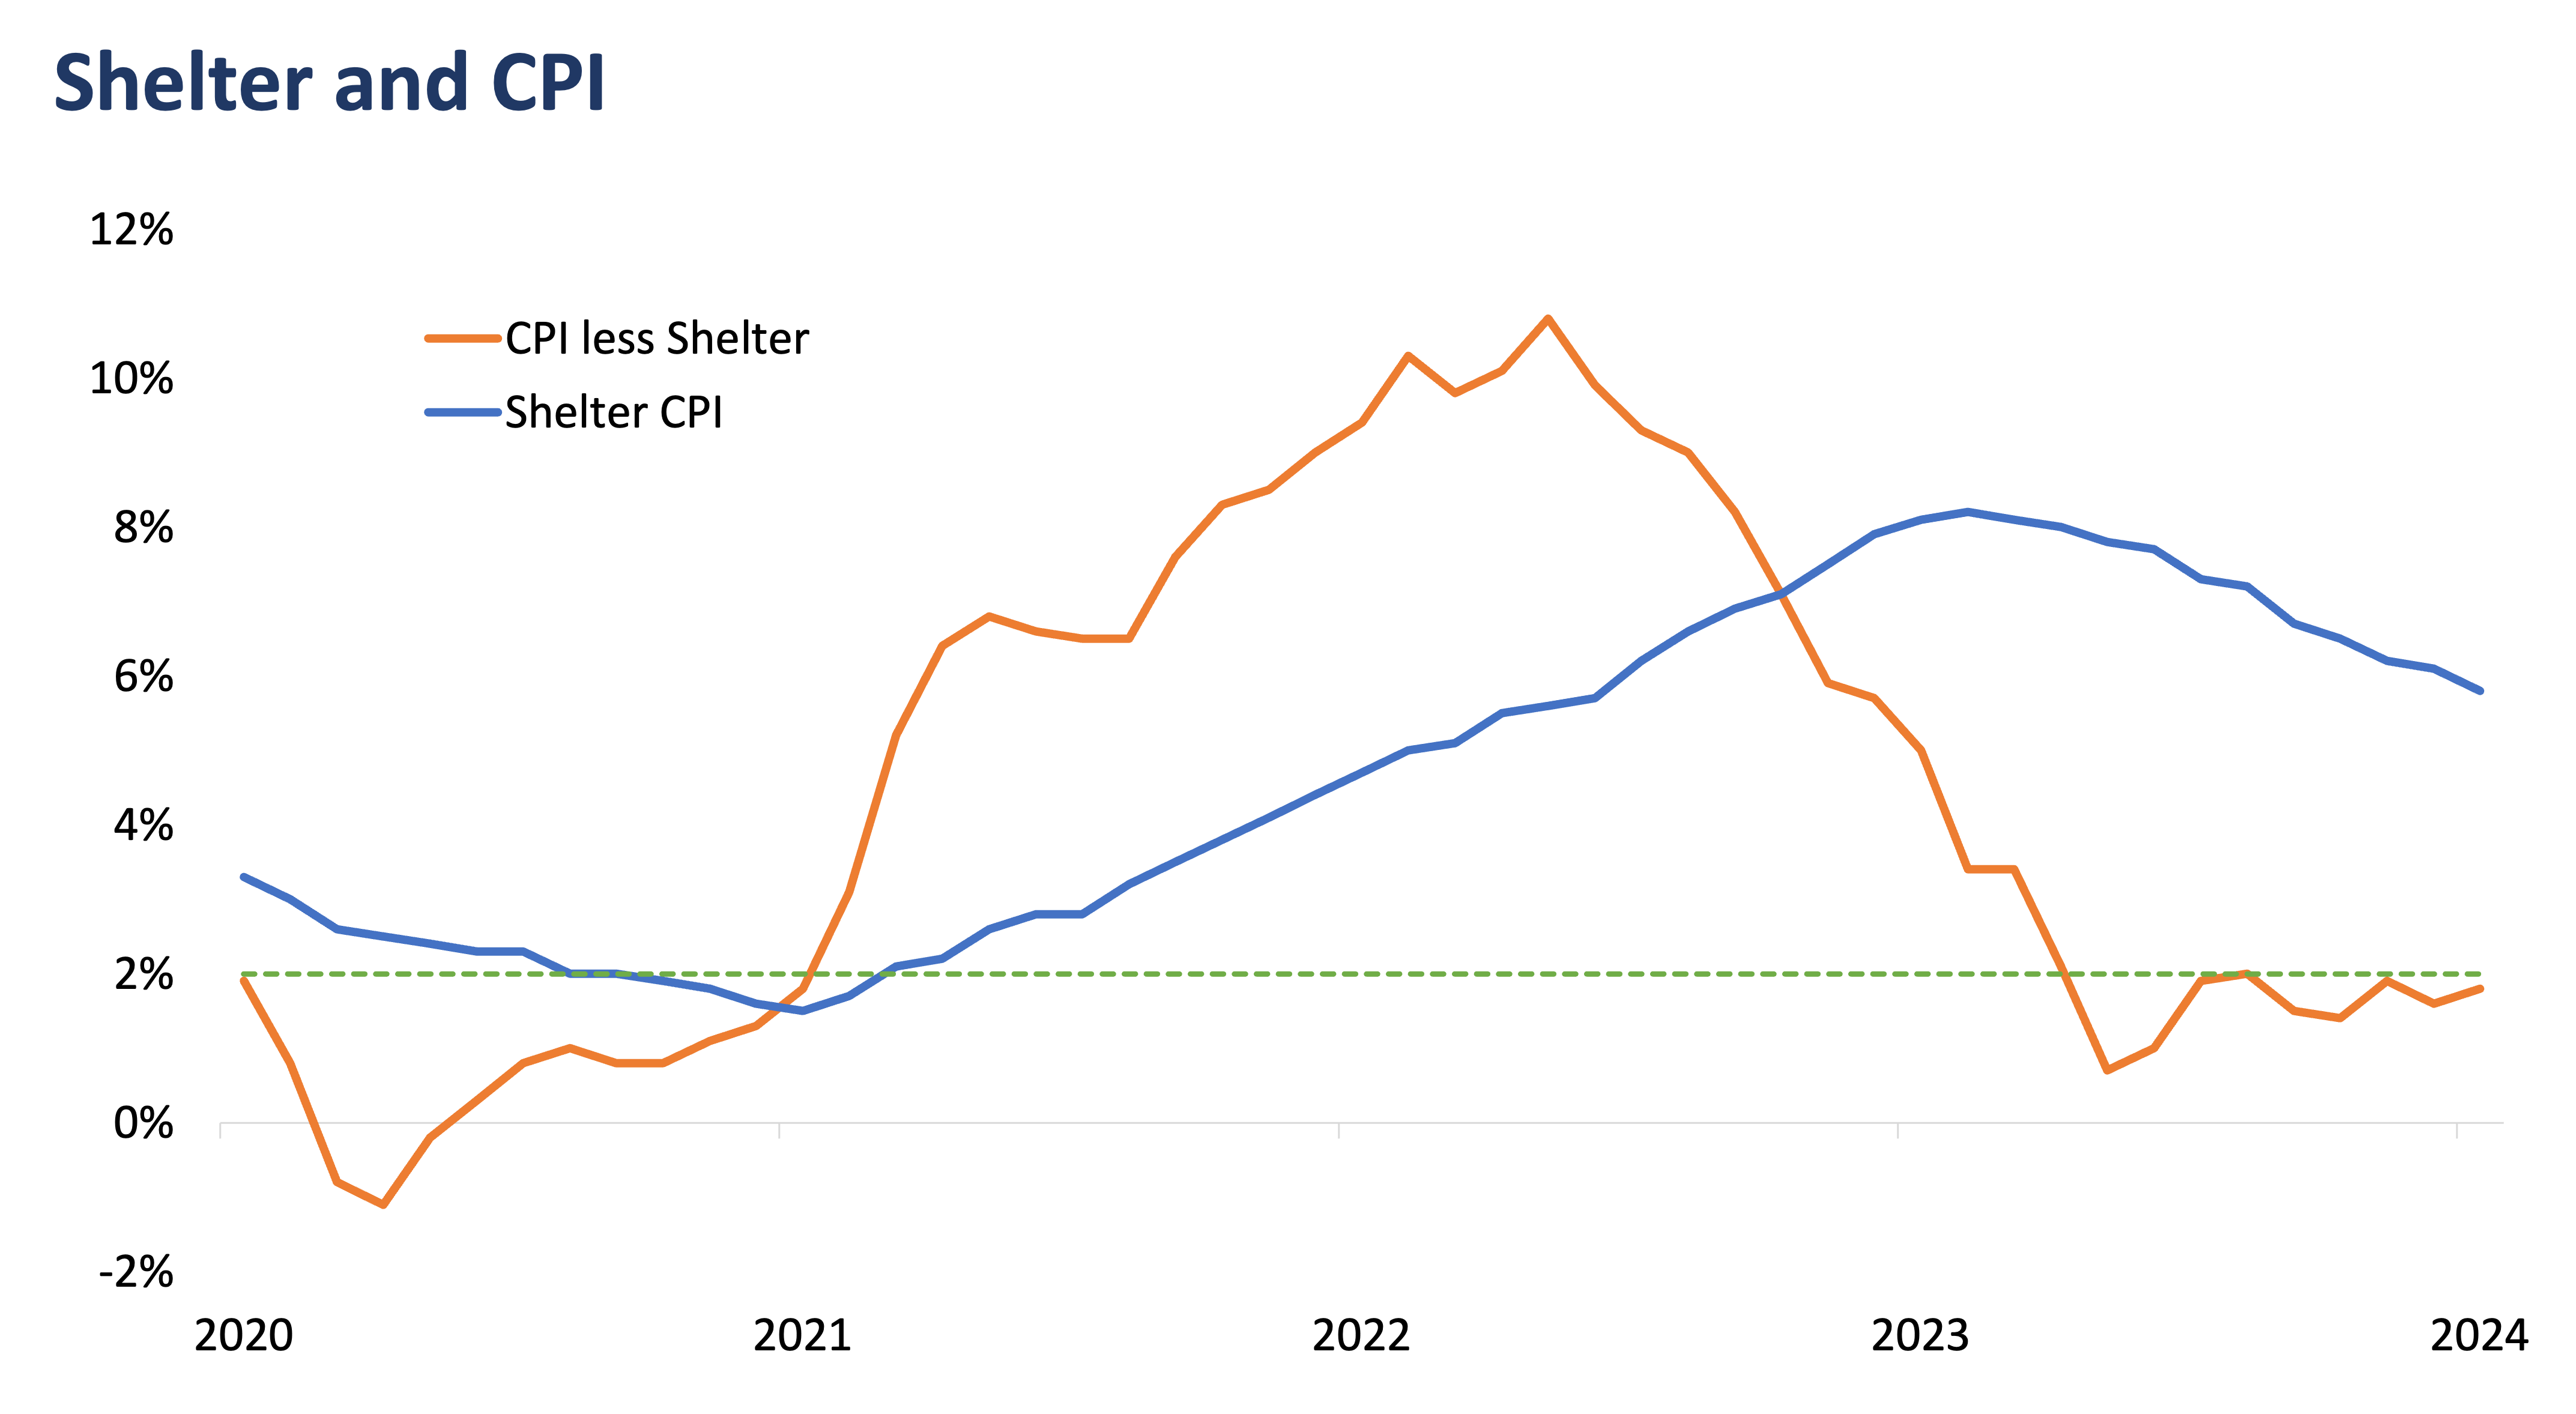
Bringing down inflation toward the 2.0% target of the Federal Reserve entails taming shelter inflation. Recent data in February show moderation in shelter inflation, which, it is hoped, resolves the unusual divergence in the shelter data in January.
The owners’ equivalent rent (OER), the largest individual component of the US consumer price index, was tamed and advanced by 0.4% month-on-month from the 0.6% month-on-month jump in January. The OER measures how much a property owner would pay if he rented his home instead of owning it.
That was roughly aligned with another important component of the index, the rent of primary residences, which accounts for the biggest expenditure in US households, at 0.5% month-on-month.
Inflation outlook
The US Federal Reserve (Fed) is monitoring inflation data as it assesses policy rates in the United States. It uses policy rates to help control the money supply and slow down inflation without excessively constraining economic growth.
Recently, the Fed released an updated Summary of Economic Projections where they revised some inflation projections. It revised its core PCE inflation projection upward in 2024 to 2.6% from 2.4% and upward in 2025 from 2.1% to 2.2%, retaining its long-run projection at 2.0.
The Fed has also maintained the Federal Funds Target Rate (FFR) at 5.25% – 5.50% for five consecutive meetings now. The FFR influences lending between banks and, thus, interest rates charged to consumers. It also influences inflation.
Investors think the Fed has reached the peak of its hiking cycle and that it may soon reduce its policy rates, confident that inflation is on its way down to the 2% target.
The big question is when. With the latest CPI and PCE data coming out each month, we can only make reasonable predictions about the trajectory of inflation, and the policy rates needed to finally tame it.
MARIAN MONETTE FLORENDO is a Research and Business Analytics Officer of the Financial Markets Sector at Metrobank. She provides macroeconomic research for the bank. Her academic background is in Mathematics and Economics. She loves solving puzzles and watching mystery movies.




 DOWNLOAD



 By Marian Monette Florendo