The Gist
News and Features
Global Philippines Fine Living
Insights
INVESTMENT STRATEGY
Economy Stocks Bonds Currencies
THE BASICS
Investment Tips Explainers Retirement
Webinars
2024 Mid-Year Economi Briefing, economic growth in the Philippines
2024 Mid-Year Economic Briefing: Navigating the Easing Cycle
June 21, 2024
Investing with Love
Investing with Love: A Mother’s Guide to Putting Money to Work
May 15, 2024
retirement-ss-3
Investor Series: An Introduction to Estate Planning
September 1, 2023
View All Webinars
Downloads
economy-ss-9
Economic Updates
Quarterly Economic Growth Release: 5.4% Q12025
DOWNLOAD
investment-ss-3
Economic Updates
Policy rate views: Uncertainty stalls cuts
DOWNLOAD
grocery-2-aa
Economic Updates
Inflation Update: BSP poised for a string of rate cuts as inflation cools
DOWNLOAD
View all Reports
Metrobank.com.ph Contact Us
Follow us on our platforms.

How may we help you?

TOP SEARCHES
  • Where to put my investments
  • Reports about the pandemic and economy
  • Metrobank
  • Webinars
  • Economy
TRENDING ARTICLES
  • Investing for Beginners: Following your PATH
  • On government debt thresholds: How much is too much?
  • Philippines Stock Market Outlook for 2022
  • No Relief from Deficit Spending Yet

Login

Access Exclusive Content
Login to Wealth Manager
Visit us at metrobank.com.ph Contact Us
Access Exclusive Content Login to Wealth Manager
Search
The Gist
News and Features
Global Philippines Fine Living
Insights
INVESTMENT STRATEGY
Economy Stocks Bonds Currencies
THE BASICS
Investment Tips Explainers Retirement
Webinars
2024 Mid-Year Economi Briefing, economic growth in the Philippines
2024 Mid-Year Economic Briefing: Navigating the Easing Cycle
June 21, 2024
Investing with Love
Investing with Love: A Mother’s Guide to Putting Money to Work
May 15, 2024
retirement-ss-3
Investor Series: An Introduction to Estate Planning
September 1, 2023
View All Webinars
Downloads
economy-ss-9
Economic Updates
Quarterly Economic Growth Release: 5.4% Q12025
May 8, 2025 DOWNLOAD
investment-ss-3
Economic Updates
Policy rate views: Uncertainty stalls cuts
May 8, 2025 DOWNLOAD
grocery-2-aa
Economic Updates
Inflation Update: BSP poised for a string of rate cuts as inflation cools
May 6, 2025 DOWNLOAD
View all Reports
Article Key Points
Article Key Points
  • What is the Fed Dot Plot?
  • Why was the Dot Plot created?
  • How do you read the Fed Dot Plot?
  • How reliable is the Fed Dot Plot?
US-Federal-Reserve-overlay
Explainer 3 MIN READ

How do we read the Fed Dot Plot?

November 4, 2022By Geraldine Wambangco

The “Dot Plot” is a convenient guide for predicting where US interest rates are going. Its predictive value may not always be spot on, but investors can’t ignore it either.

FEATURED INSIGHTS

Since 2012, the US Federal Reserve has published a chart known as the “Dot Plot”, which maps out policymakers’ expectations for where short-term interest rates could be headed in the future. It is closely watched by investors, economists, and other market watchers for indications on the future trajectory of the US interest rate.

What is the Fed Dot Plot?

Every quarter, the policy-setting Federal Open Market Committee (FOMC) publishes a Summary of Economic Projections (SEP) which includes the Dot Plot, a chart showing where each of the 19 members of the FOMC expect the federal funds rate to be for the next three years and the long term. The 19 Fed officials who contribute to the Dot Plot include seven members of the Board of Governors of the Federal Reserve System and presidents of the 12 regional banks. Each dot on the chart represents the forecast of every Fed official sans their identity.

The long term view of the Fed officials represents the peak or “neutral rate” for the federal funds rate after the central bank has finished tightening or loosening monetary policy. It is the rate at which the monetary policy is neither accommodative nor restrictive, or the rate if economic growth and inflation rate are both at its natural rate.

Why was the Dot Plot created?

Fed officials started using the Dot Plot in 2012 at a time when the US economy was recovering from the aftermath of the 2008 financial crisis and when interest rates were near zero. The US central bank wanted to give the financial markets an advance look at what officials were thinking before they make any official policy decisions during their meetings. It was also introduced in an attempt to become more transparent about its policies moving forward.

The Dot Plot was a form of an “aggressive forward guidance”, a concept that former US Fed Chairman Ben Bernanke coined to prepare markets and guide investors’ expectations.

How do you read the Fed Dot Plot?

When one is looking at the Dot Plot, every dot actually tells us a member’s view of the range where rates should be for a particular period. Each dot represents the middle or median of a range. In short, the dot is not a fixed or specific figure that a member is targeting.

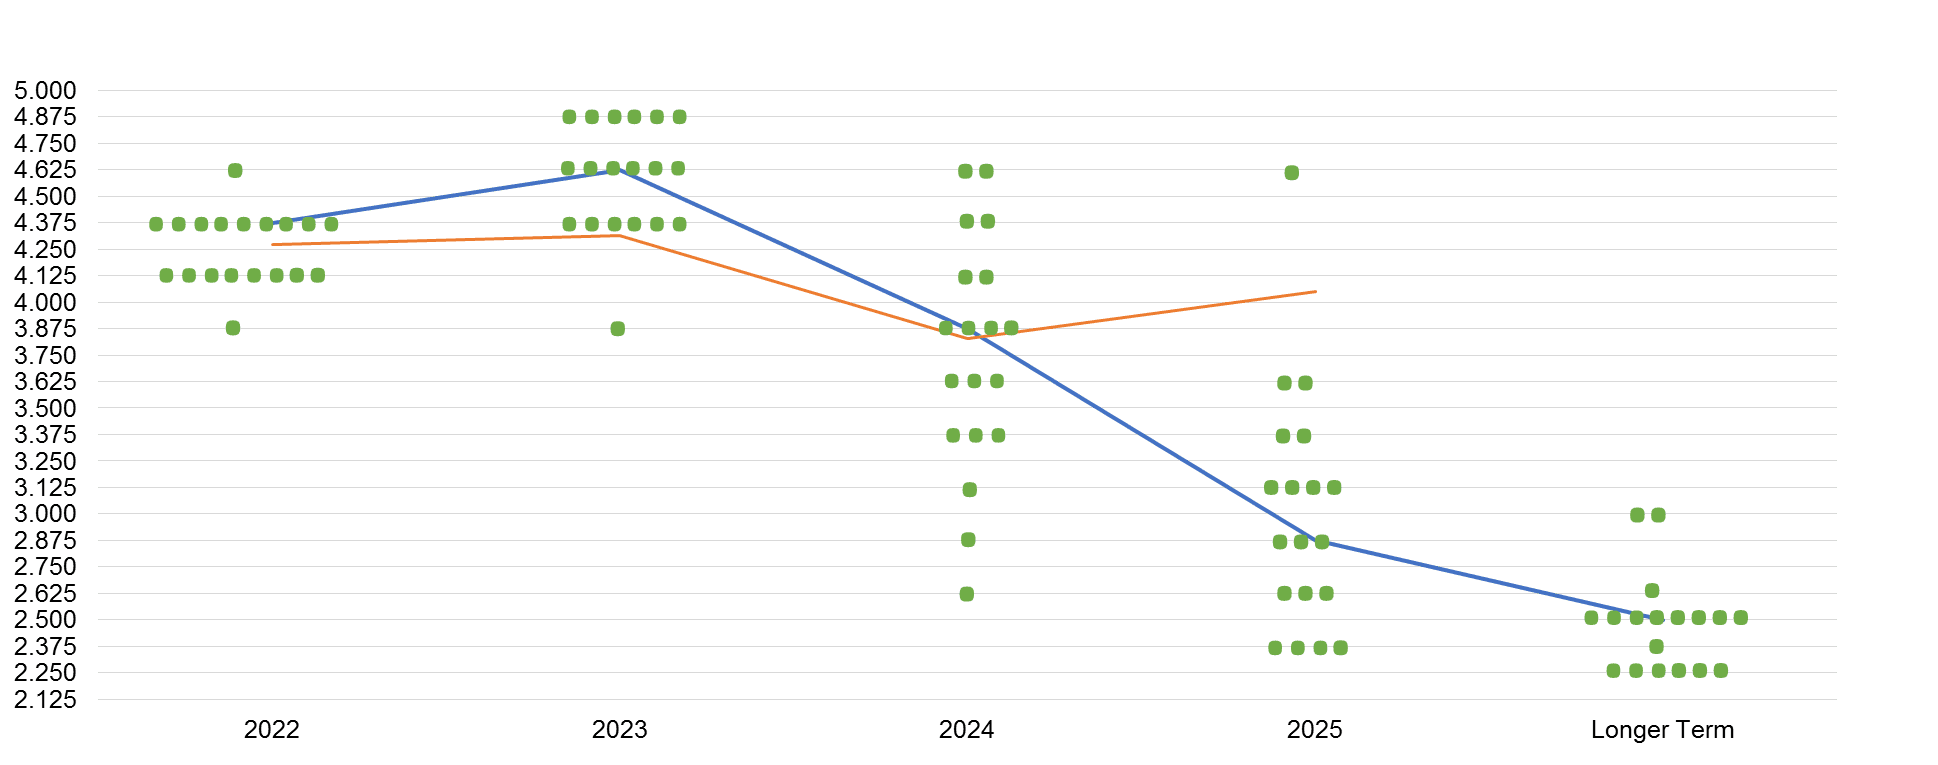
Let us look at the September 2022 FOMC Dot Plot:

The X-axis of the chart below represents the years, while the Y-axis represents the target fed futures target rate.

By yearend 2022, majority of Fed officials believe that the fed funds target rate should be in the range of 4.25% to 4.5%.

By yearend 2023, six Fed officials believe that the fed funds target rate should be in the range of 4.75%-5%. Six members also think that the interest rate will be in the range of 4.5%-4.75%, while another six think it will end within 4.25%-4.5%.

Now try it yourself and read the dots for 2024 and 2025.

With the latest inflation and employment, forward expectations based on the Fed Dot Plot are higher US policy rates for longer, with no cuts until 2024, consistent with Fed statements that inflation needs to slow for several months before they ease off on tightening.

How reliable is the Fed Dot Plot?

While the Fed Dot Plot has been very helpful and useful for investors and economists for gauging potential changes in monetary policy, Fed officials mentioned to not place great emphasis on the Dot Plot. The central bank’s monetary policy claims to be largely data-driven, depending on economic trends, inflation, and global events. As a result, long-term projections carry less weight than those of the near term.

For example, the Fed did not stick to its December 2019 predictions as the coronavirus pandemic surprised the whole world in 2020. The Federal Reserve altered the country’s key policy rate by setting it near zero.

GERALDINE WAMBANGCO is a Financial Markets Analyst at the Institutional Investors Coverage Division, Financial Markets Sector, at Metrobank. She provides research and investment insights to high-net-worth clients. She is also a recent graduate of the Bank’s Financial Markets Sector Training Program (FMSTP). She holds a Master’s in Industrial Economics (cum laude) from the University of Asia and the Pacific (UA&P). She takes a liking to history, astronomy, and Korean pop music.

Read More Articles About:
Worldwide News Philippine News Rates & Bonds Equities Economy Investment Tips Fine Living

You are leaving Metrobank Wealth Insights

Please be aware that the external site policies may differ from our website Terms And Conditions and Privacy Policy. The next site will be opened in a new browser window or tab.

Cancel Proceed
Get in Touch

For inquiries, please call our Metrobank Contact Center at (02) 88-700-700 (domestic toll-free 1-800-1888-5775) or send an e-mail to customercare@metrobank.com.ph

Metrobank is regulated by the Bangko Sentral ng Pilipinas
Website: https://www.bsp.gov.ph

Quick Links
The Gist Webinars Wealth Manager Explainers
Markets
Currencies Rates & Bonds Equities Economy
Wealth
Investment Tips Fine Living Retirement
Portfolio Picks
Bonds Stocks Model Portfolio
Others
Contact Us Privacy Statement Terms of Use
© 2025 Metrobank. All rights reserved.

Read this content. Log in or sign up.

​If you are an investor with us, log in first to your Metrobank Wealth Manager account. ​

If you are not yet a client, we can help you by clicking the SIGN UP button. ​

Login Sign Up