Ask Your Advisor: The US yield curve and your portfolio
What does the Treasury yield curve reveal about the US economy, and how should you position your portfolio?
September 29, 2026 by Earl Andrew Aguirre
Share this article:
Share this article:
In bond investing, the longer a bond’s tenor, the higher its annual yield. This general rule compensates investors for locking up their funds for an extended period, as well as for the added risk that the bond issuer might not repay.
When you map bond yields across different tenors on a graph, you get a yield curve, which is normally upward sloping. Longer tenors, higher yields.
But bonds are never static – their yields and prices can fluctuate with market supply and investor demand, driven by expectations about the economy. In another explainer, we discuss how bond yields and prices are inversely related.
When investors think a recession or slowdown is ahead, they expect the central bank to rapidly cut interest rates to support the economy. To protect their portfolios, investors rush to sell short-dated bonds and buy long-dated bonds.
This huge demand for long-dated bonds drives yields down, resulting in an inverted yield curve.
Downward slope was the pandemic new normal
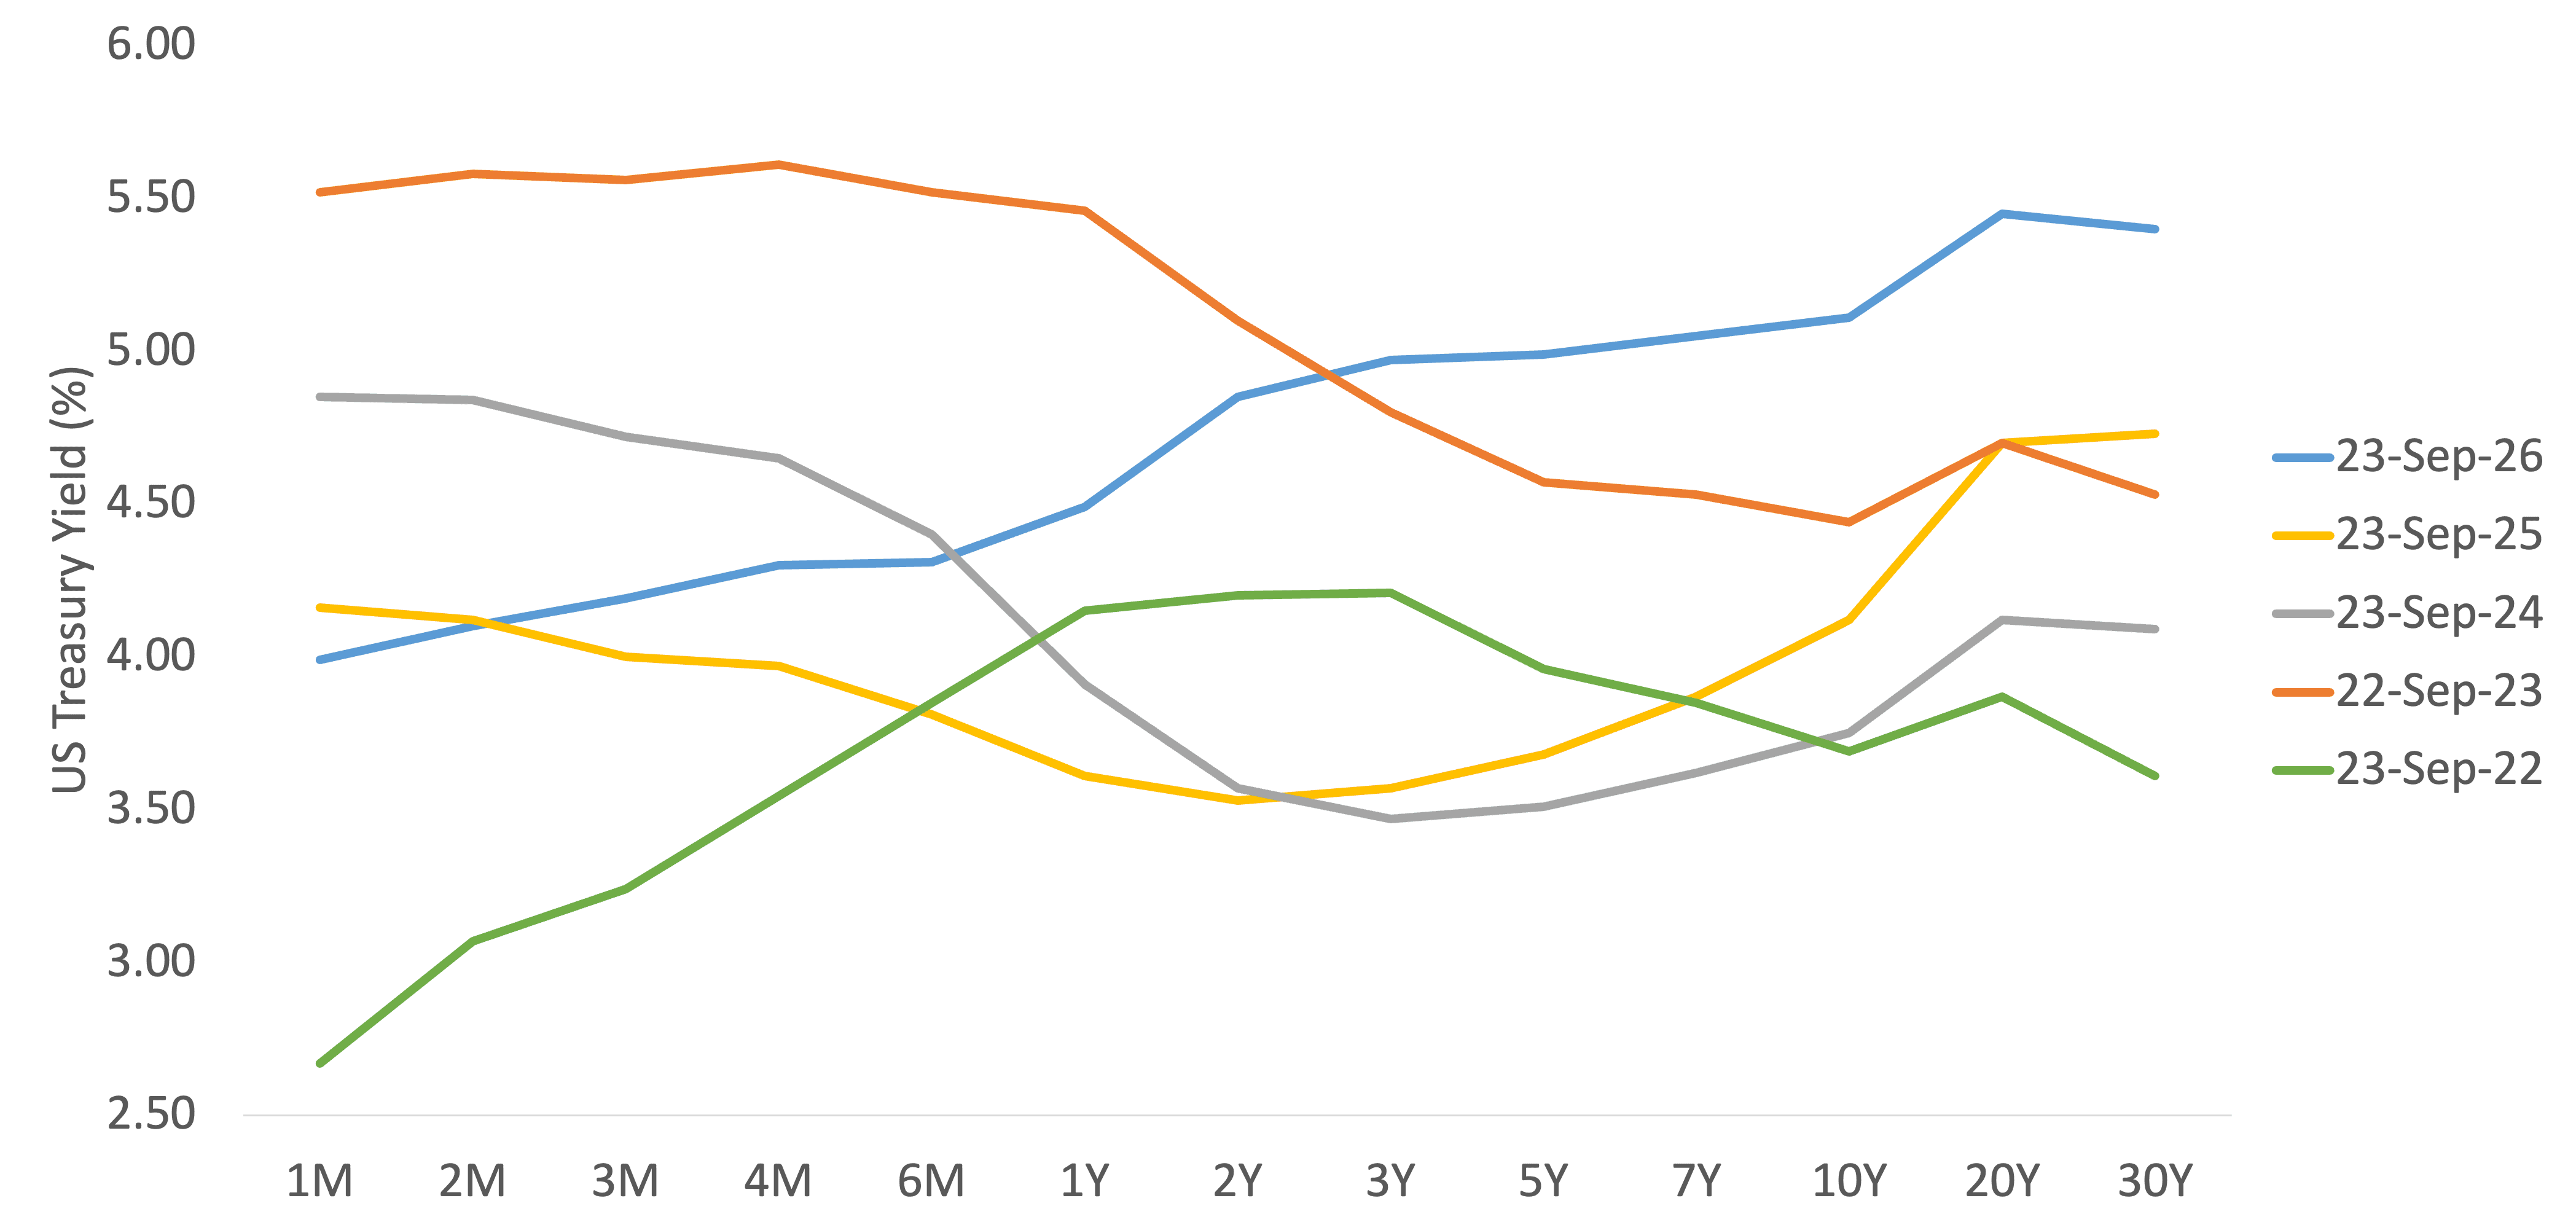
The yield curve for US Treasury bills and bonds had actually been inverted for the past few years and only recently reverted to an upward slope. The chart below shows the historical yield curves from September 2022 to 2026.
US Treasury Yield Curves (September 2022 to 2026)
As early as 2021, inflation started to creep in as supply chains disrupted by the COVID-19 pandemic had to contend with surging demand. This was exacerbated by Russia’s invasion of Ukraine in February 2022, which caused a rise in global commodity prices.
In response, the US Federal Reserve aggressively hiked interest rates from a low of 0.25% to a peak of 5.50% by July 2023. Yields at the front of the curve rose, but the rest of the curve did not follow normal yield curve dynamics.
Instead, investors were worried that the rapid rise in borrowing costs would dampen business activity, cause mass layoffs, and result in an economic recession. They were already thinking two steps ahead and bought bonds at the back of the curve, expecting lower interest rates to come.
That narrative lasted from 2022 to 2025, with the US Treasury yield curve shifting downward as the Fed started to cut rates, but still remaining mostly inverted. Except for two separate quarters of economic contraction, a recession did not happen, thanks in part to exceptional institutions, a strong labor market, and resilient consumer spending.
Normal curve returns during a not-so-normal time
As of this writing, the US Treasury yield curve is clearly upward sloping, but this is far from normal. Conflict in the Middle East since March 2026 and higher global oil prices have stoked inflation fears once again.
The Fed is back in a monetary tightening cycle, but this time nobody expects a recession, as the economy remains resilient and top US tech companies raise capital to further develop artificial intelligence (AI) and other innovations.
Another factor keeping yields elevated is a widening US fiscal deficit of around USD 1.97 trillion, which has been supported by national debt surpassing USD 40 trillion. More long-term US Treasury bonds are being issued to finance government spending and payments on older bonds.
While the situation in the Middle East has shown that the US dollar remains a key safe-haven asset, appetite for government bonds has begun to sour, prompting the Treasury Department to offer higher yields on new bonds to attract global investors.
Where should investors position?
We are reluctant to extend duration, as 10- and 30-year US Treasury yields climb to highs last seen in 2007. Credit spreads on US dollar-denominated sovereign and corporate bonds are also historically tight, despite global uncertainties.
Locking in long-dated bonds now exposes investors to potentially higher Treasury yields and wider credit spreads, which reflect the interest rate difference between a riskier bond, such as a corporate bond, and a benchmark bond like a US Treasury.
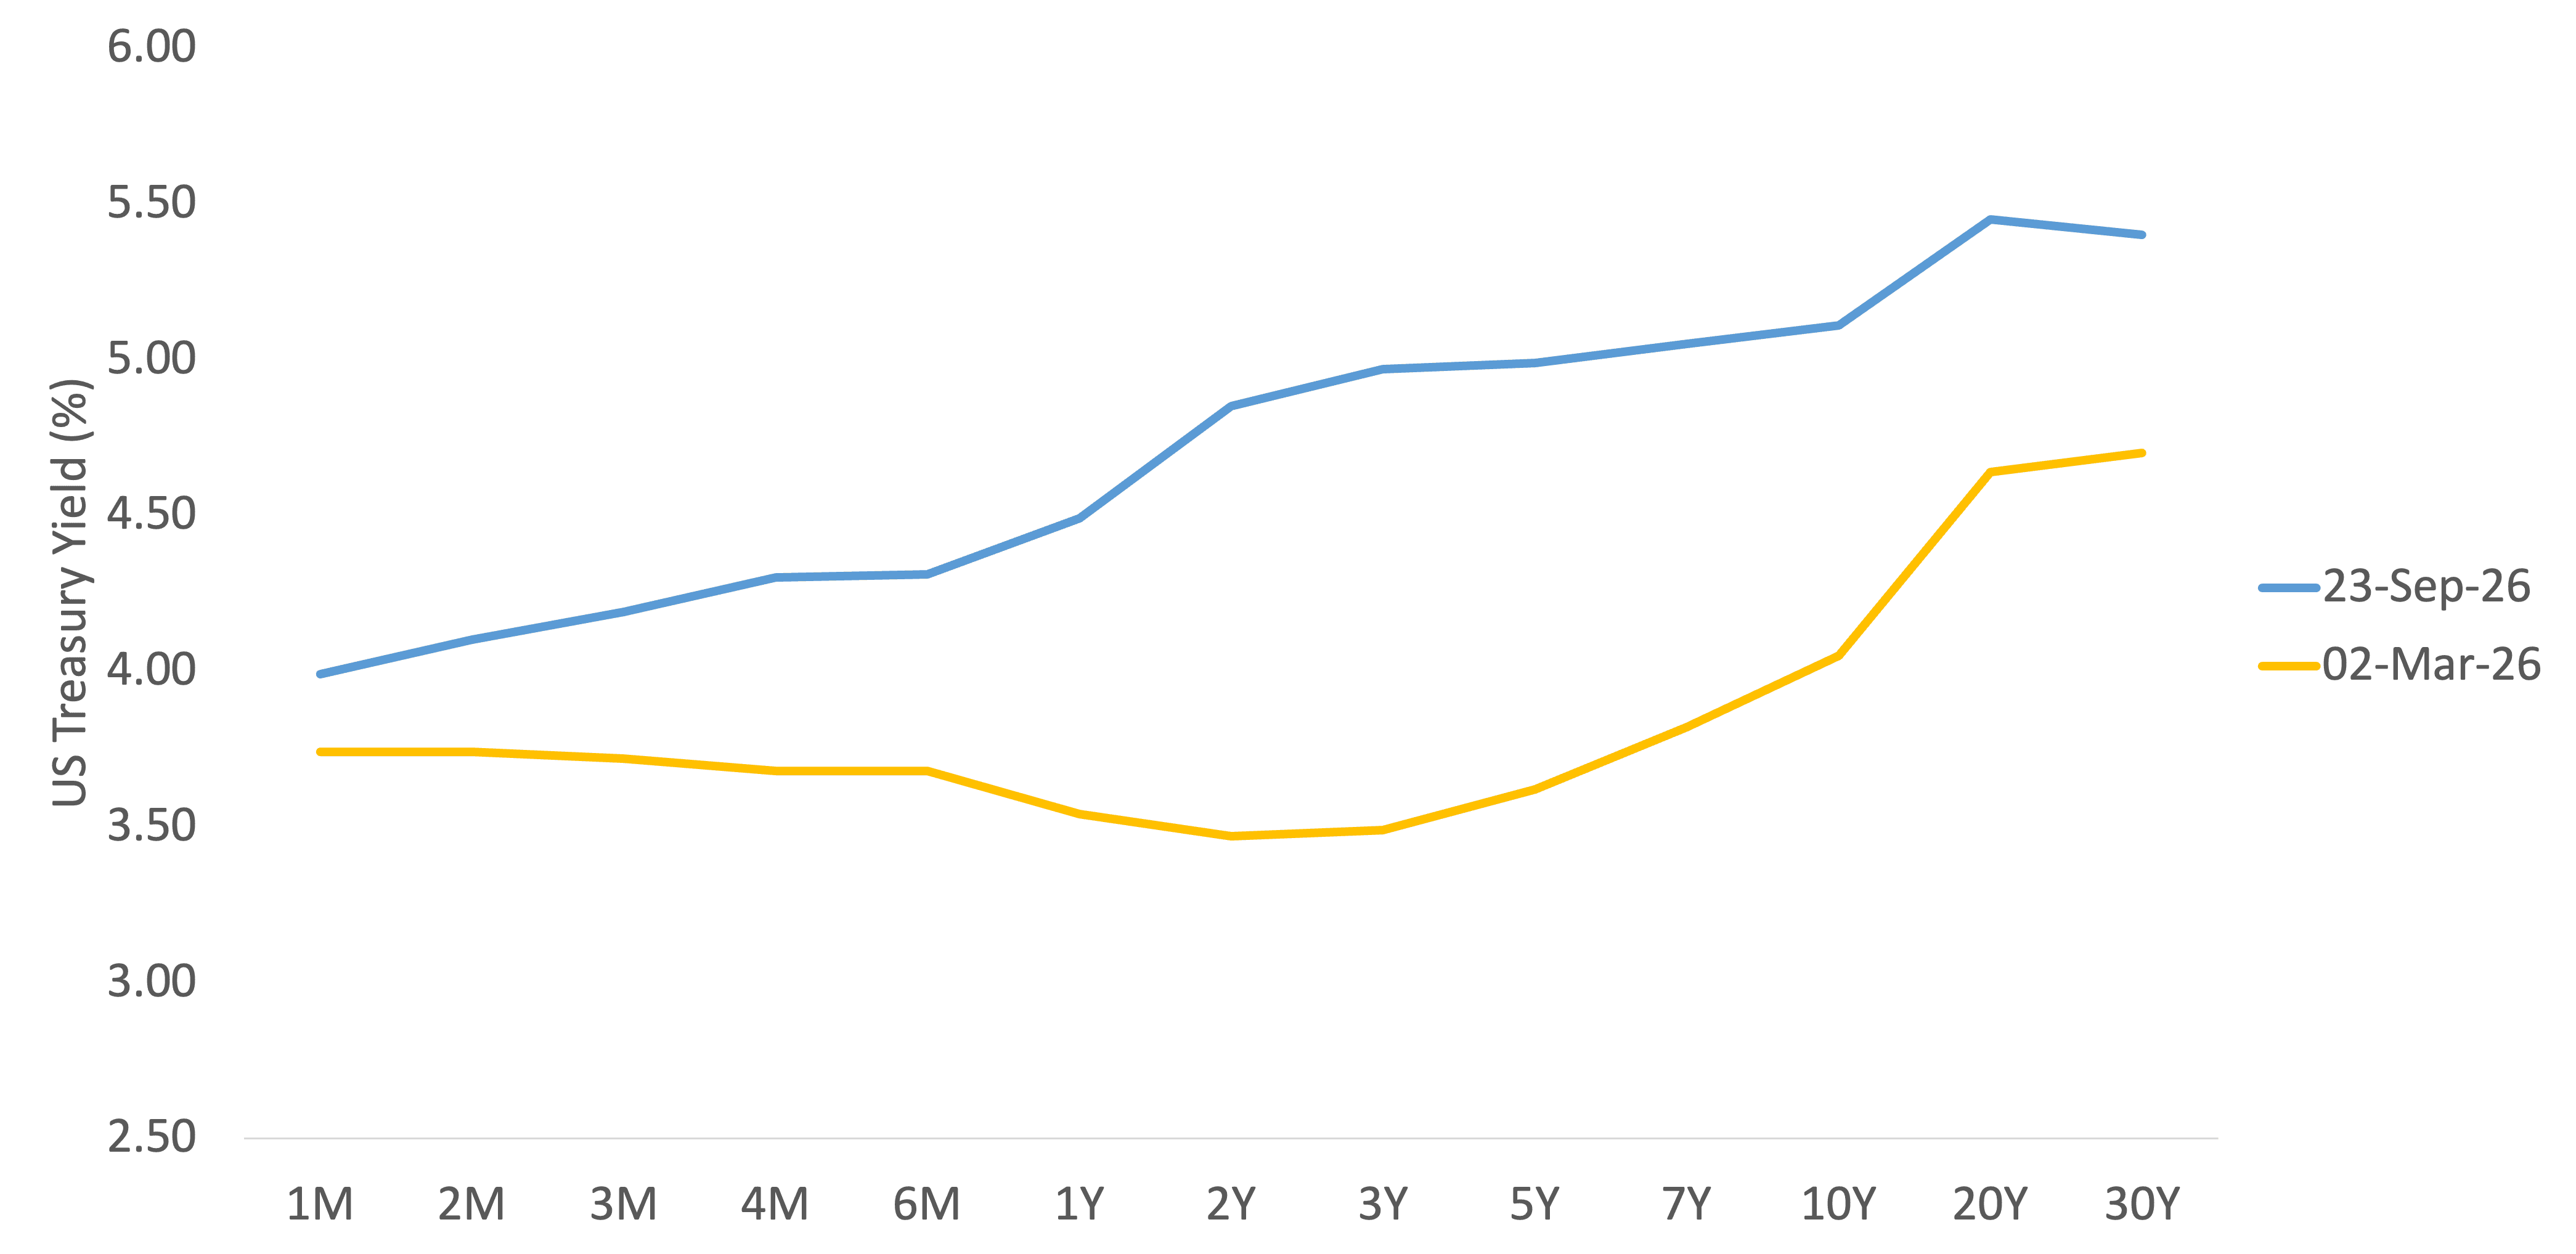
US Treasury Yield Curves (March 2, 2026 & September 23, 2026)
While yields at the front of the curve, through the 5-year area, have also risen by an average of 83 basis points (bps) since the start of the conflict in March, their lower duration has kept these bonds relatively insulated from interest rate risk. In this environment, it makes sense to position here.
Investors in money market securities and bonds maturing in less than a year can take advantage of potentially higher short-dated yields should the Fed continue to hike interest rates. These also allow investors to be tactical and nimble if conditions warrant extending duration, or investing in longer-term bonds.
The Fed forecasts US inflation to average sub-3% in 2027. If this view pans out and a path to the 2% inflation target looks sustainable, then the tightening cycle could quickly revert to an easing cycle.
We also want to take advantage of elevated levels of around 4.50% to 5.00% in the 1- to 5-year space. Looking at the shape of the present curve, the 2-year yield offers the largest marginal increase relative to the rest of the curve at +36 bps.
On the other hand, there’s not really much yield pickup beyond 5 years, while sensitivity to interest rate risk increases.
How does this affect Philippine peso bonds?
The Bangko Sentral ng Pilipinas (BSP) entered a new tightening cycle much earlier due to the country’s own inflation problems. But the central bank may also be forced to match the Fed’s moves in order to maintain the differential between Philippine and US interest rates.
As of this writing, the BSP policy rate is 5.00%, a 100-bp premium over the Fed’s policy rate of 4.00%.
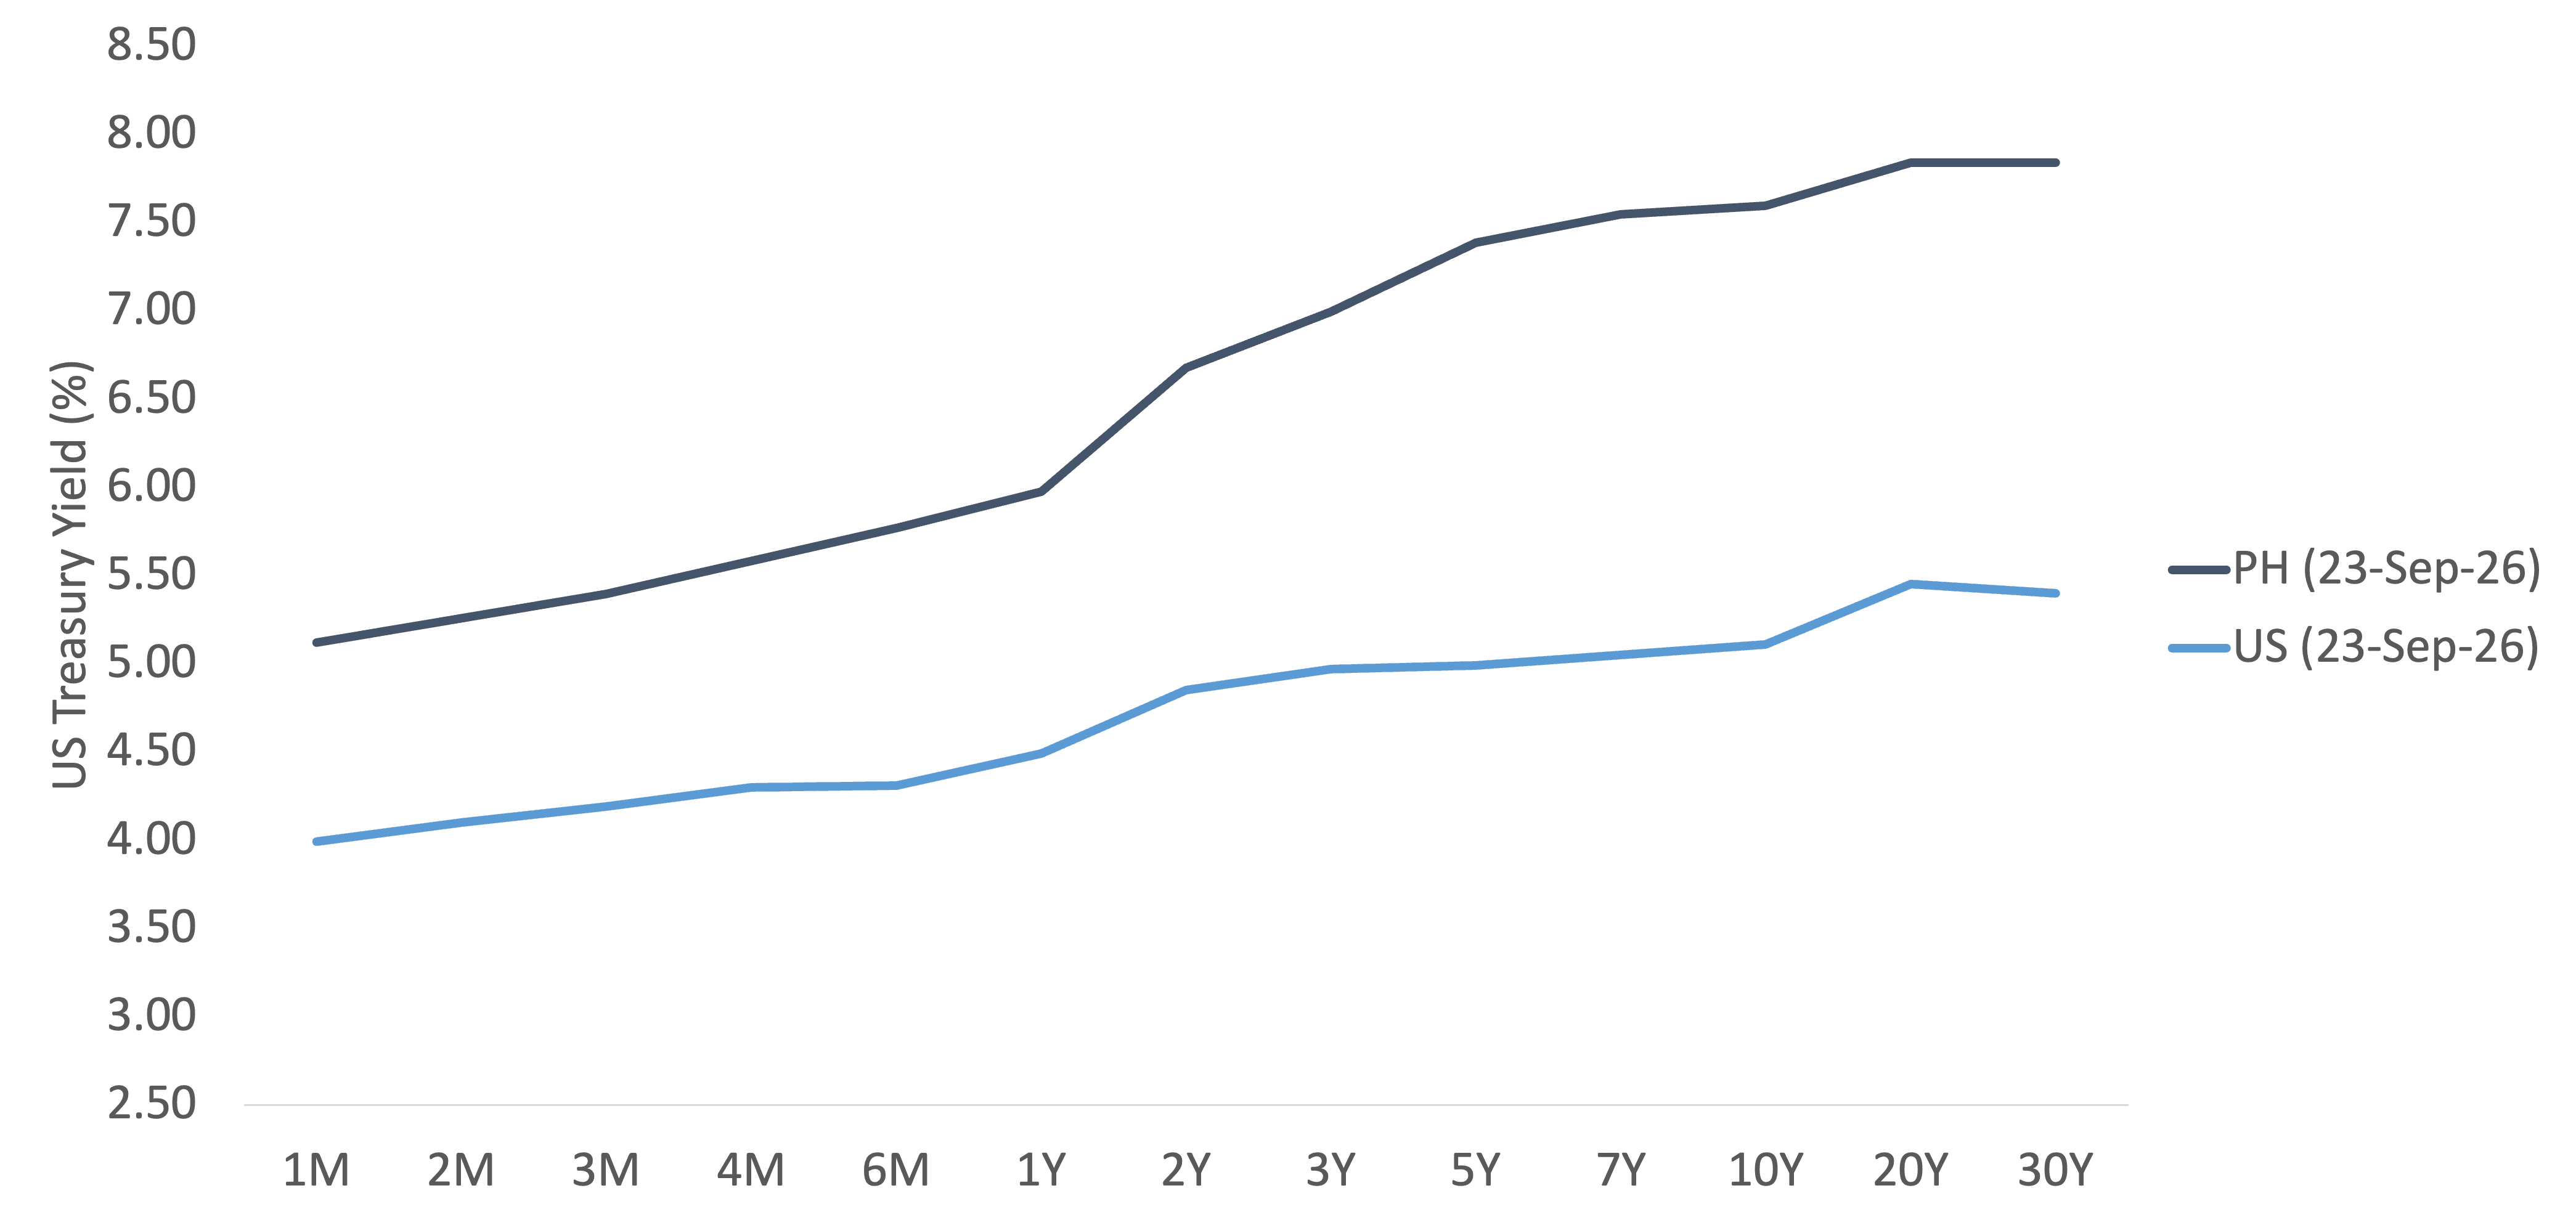
PHP Bloomberg Valuation (BVAL) & US Treasury Yield Curves
The differentials widen further in the bond market, as investors demand greater yield premium in peso bonds over dollar bonds. Yields in the front, belly, and back of the peso curve are higher than their US Treasury counterparts by an average of 130, 220, and 240 bps, respectively.
A rising US Treasury yield curve adds upward pressure to peso yields, so investors should also stay tactical and defensive in short- to medium-term peso bonds.
For more information, visit our bonds page for regular updates and our list of suggested peso- and dollar-denominated bonds.
Want to have a conversation about bond investing? You may go to your branch of account, or reach out to your Wealth Specialist or Relationship Manager.
(Disclaimer: This is general investment information only and does not constitute an offer or guarantee, with all investment decisions made at your own risk. The bank takes no responsibility for any potential losses.)
EARL ANDREW “EA” AGUIRRE is the Head of the Investment Counselor Department under the Financial Markets Sector of Metrobank. He has more than a decade of experience in foreign exchange, fixed income securities, and derivatives sales. He has a Master’s in Business Administration from the Ateneo Graduate School of Business. His interests include regularly traveling to Japan and learning its language and culture.