Technical Analysis: “Flash Crash Monday” and the risks that lie ahead
What is a flash crash and how does it affect your investment strategy? Learn more about this phenomenon by reading this article.

It was a convergence of fears and euphoria. The chase of anything to do with AI (artificial intelligence), the triggering of the Sahm Rule and the possibility of a recession, and the unwinding of yen carry trades — which is a strategy to profit from the interest rate differentials of between Japan and the US or other countries — all led to a flash crash last August.
What is a flash crash?
A flash crash in investing happens when the price of a stock or bond or the whole market dramatically and rapidly drops, then recovers within a few minutes. Although the causes of flash crash can’t be determined all the time, it can happen due to various reasons.
Flash crashes can happen because of the rapid sell-off of stocks and bonds. High-frequency trading firms are often the ones in blame when this occurs.
What do we make of this?
Since October 2023, the US equity market has been priced to perfection by the markets amid expectations of incoming rate cuts, strengthening the US Fed’s ability to engineer a soft landing. The AI-driven mania spurred a “buy now, think later” mentality, pushing the S&P 500 to 5,600, a 37%% increase from trough to peak.
However, reality fell short of expectations when US unemployment rose to 4.3% — an economic indicator for investment — triggering the Sahm Rule. Across the globe, the Bank of Japan’s (BOJ) rate hikes led to a sharp rise in the yen, intensifying the sell-off as carry trades were forced to be unwound.
Too much fear is a tactical contrarian signal
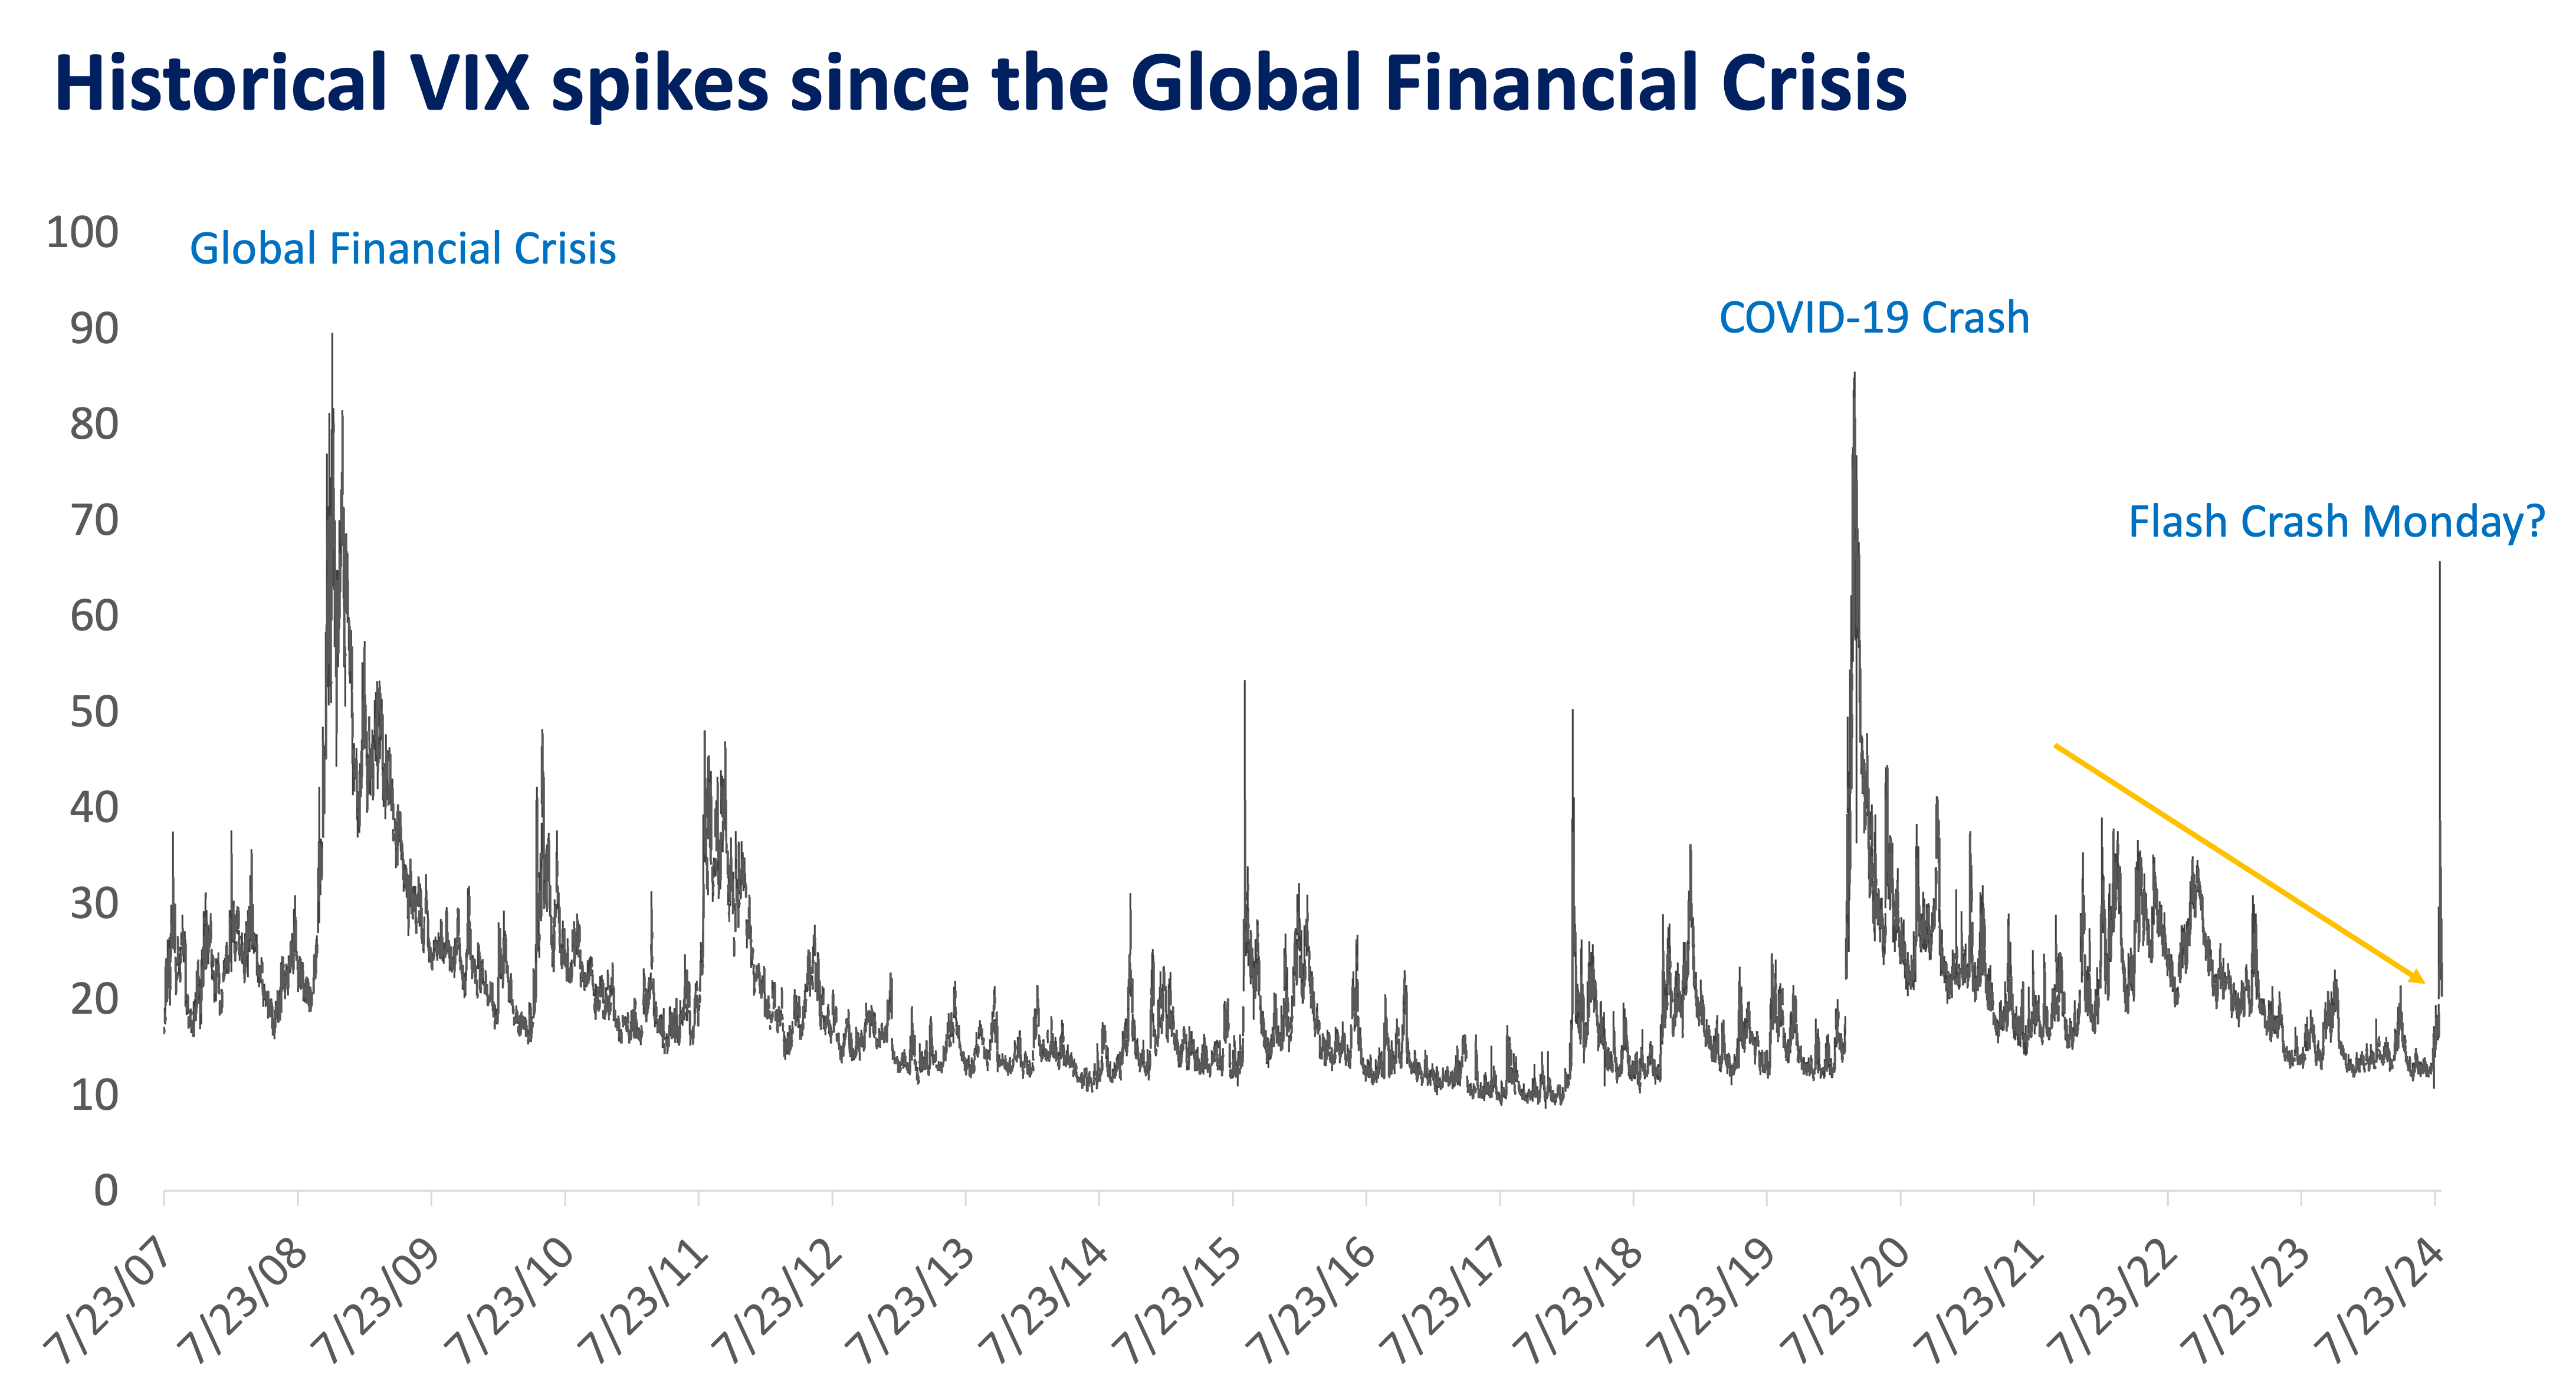
The VIX index, widely known as the “fear index,” reflects market expectations of near-term volatility based on the prices of S&P 500 index options. The release employment data indicating rising unemployment (+4.3%) on August 2 triggered a breakout in the VIX, breaking the downtrend, as doubts about a soft landing grew.
The series of events leading up to Flash Crash Monday last August 5 caused investors to rush for the exits, pushing the VIX to an intraday high of 65.73, which is the third highest spike in the last 16 years. For comparison, the VIX reached a high of 85.47 during the COVID-19 pandemic and 89.53 during the 2008 Global Financial Crisis.
Since the US is not in a recession, such intense fear converging without a clear cause can act as a contrarian indicator on whether to trade or invest, a signal that it is a good time to do the opposite of what everybody is doing, potentially triggering a bounce in equity markets from their lows.
Charting ahead
Patterns are made because history rhymes. Market prices are mere reflections of man’s greed and fear. The events of Flash Crash Monday triggered a major sell-off and an opposite contrarian bounce.
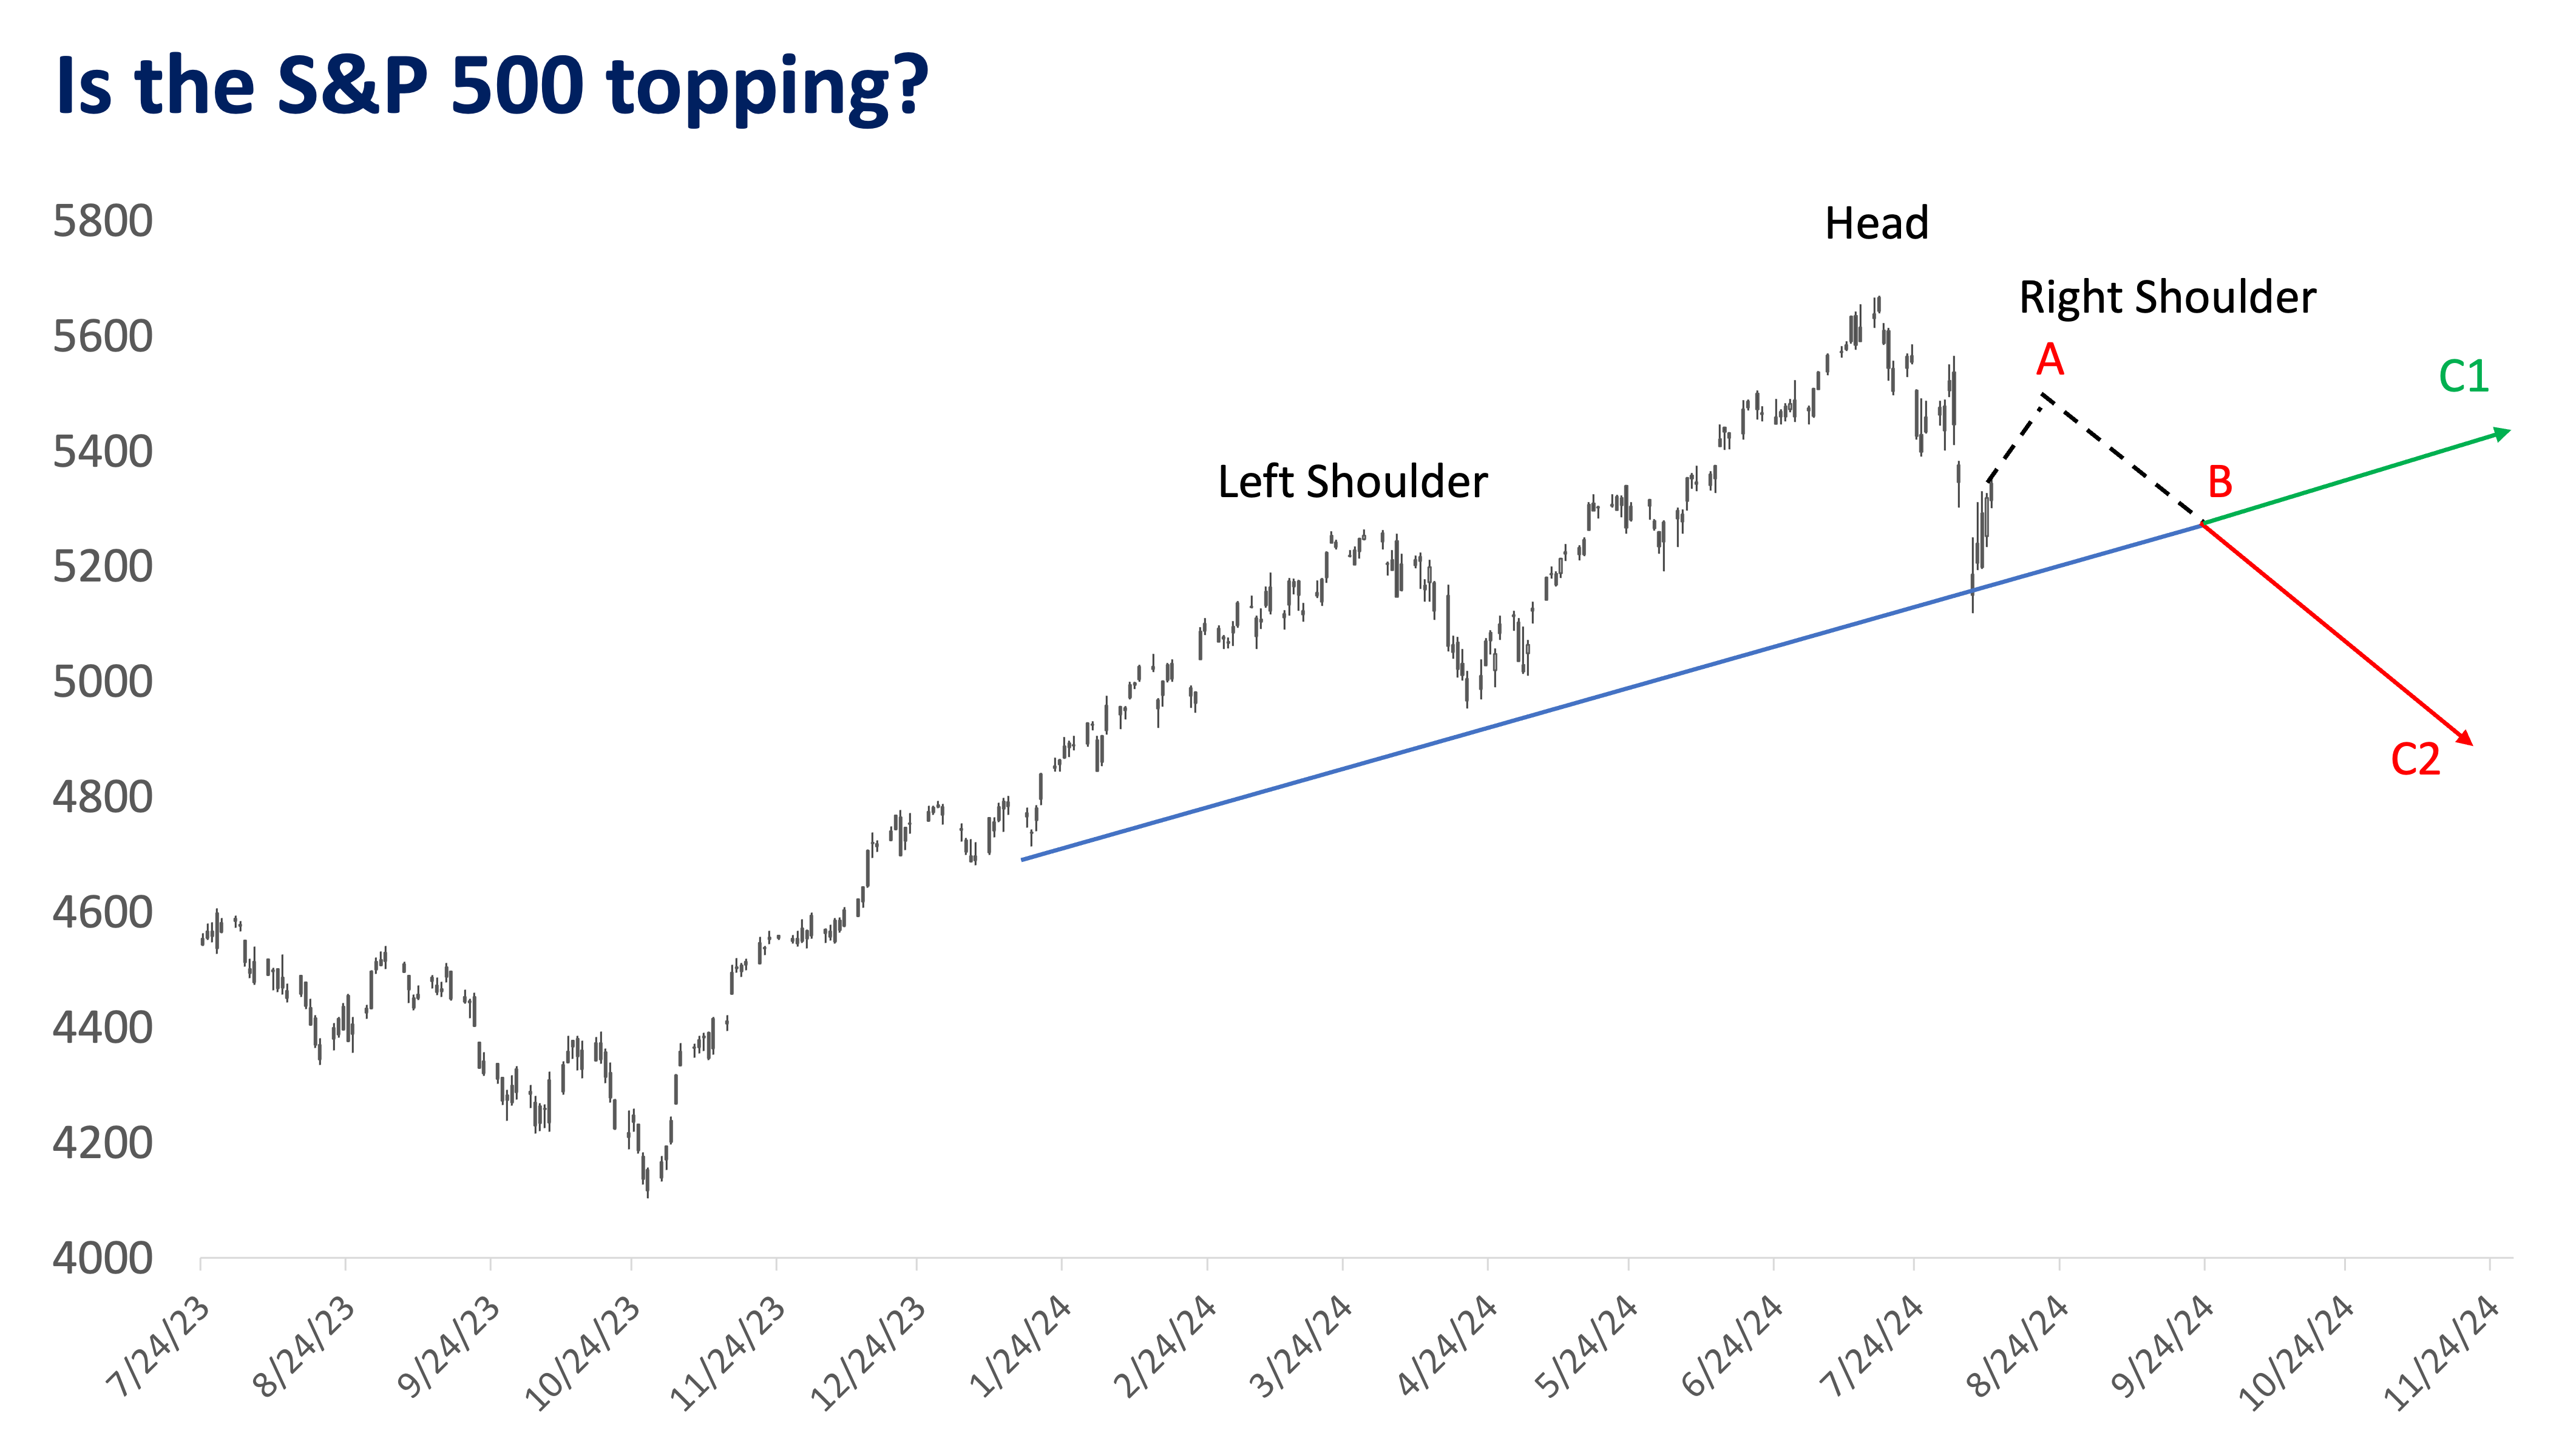
The bounce after the panic sell-off created a base for a “potential” topping pattern called a Head & Shoulders (H&S), which may indicate a potential reversal from an uptrend. While the right shoulder has yet to form, the chart above is a projection of what may unfold from known upside and downside risks.
Rise of (A): The US is not in recession right now and rate cuts are expected in September, which is why markets can rally on optimism that a soft landing can be achieved.
- The height of A cannot be higher than the Head. The H&S is voided if the price reaches a new high.
- Technical studies show (A) may likely rise to a range of 5,450-5,600.
Right Shoulder (B): The second half of 2024 carries a lot of risks, including the upcoming US elections and risks to growth, with the lag effect of the rate hikes seeping deeper into the economy.
- Once price has fallen back into the upward sloping blue line, it creates a strong support line known as the neckline. A and B must occur in sequence to complete the H&S pattern.
After the completion of the H&S, two scenarios may unfold.
The Fed’s moment of truth (C1): The Fed’s goal is to bring down inflation without significantly increasing unemployment, achieving a soft landing. If the Fed is successful, rates would come down, growth will happen and risk-taking will resume.
Failed H&S formations are considered continuation patterns instead of reversal signals.
The topping pattern (C2): Deflationary or recessionary risks are present but have yet to unfold. Financial markets will lead the economy by six to eight months, so a break below the neckline would signal a major top in markets, with the US entering a recession in early to mid-2025.
In the event of a breakdown, proper price targets cannot be determined at this time given the absence of the right shoulder. Initial drawdown estimates range from 4,800 to 4,600.
Takeaway
Disinflation, or the slowing down of inflation, continues to be a positive development for both equities and fixed income. However, the emergence of deflationary characteristics, or falling prices, and further weakness in economic data could shift the current risk-on environment to a risk-off scenario, where fixed income would be more favored.
Although the US has not yet entered a recession, it is crucial to consider both upside and downside risks to protect your gains and safeguard capital. As the global economy and financial markets enter this pivotal point, understanding these risks and strategically positioning for them will be essential for building long-term wealth.
To take into account all your investment goals and constraints, we advise seeking assistance from your investment counselor before you invest.
(Bookmark and visit Metrobank Wealth Insights at www.wealthinsights.ph daily for investment insights and ideas. If you are a Metrobank client, please get in touch with your relationship manager or investment specialist for assistance in accessing exclusive content. Not a client yet? Please sign up here so you can begin your wealth journey with us.)
KYLE TAN, MSFE, CSS is a Portfolio Manager at Metrobank’s Trust Banking Group, managing the bank’s Global Unit Investment Trust Funds (UITF). He holds a Master’s degree in Financial Engineering from the De La Salle University, a Level 3 candidate of the Chartered Market Technician (CMT) certification course and a PSE Certified Securities Specialist (CSS). He spends his free time working out, training at the gun range, or hunting for rare Star Wars collectibles.




 DOWNLOAD


 By Kyle Tan